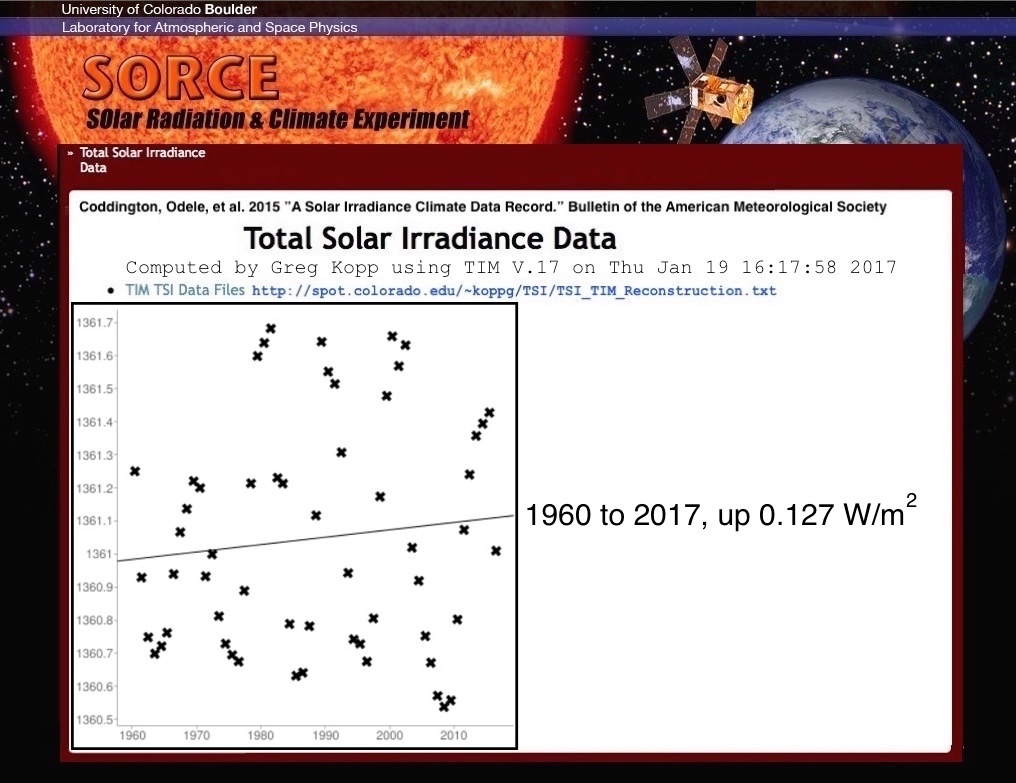
You can get just about whatever trend you want on an oscillating dataset by adjusting the start and end times to either a trough or peak as needed. Start four years earlier on this data and you find that TSI has dropped 0.0183 W/m^2 over the period.
Question, if someone knows: How significant is the variation in solar irradiance? E.g., is there an approximate way to say approximately how much temperature change would be expected from a 1 W/m^2 change in solar irradiance?

7 comments:
You can get just about whatever trend you want on an oscillating dataset by adjusting the start and end times to either a trough or peak as needed. Start four years earlier on this data and you find that TSI has dropped 0.0183 W/m^2 over the period.
Question, if someone knows: How significant is the variation in solar irradiance? E.g., is there an approximate way to say approximately how much temperature change would be expected from a 1 W/m^2 change in solar irradiance?
Cheers
Hi DiC,
For reference, raising CO2 from 280 to 400 results in a forcing of 1.9W/m^2.
A doubling of CO2 results in a forcing of 3.7 W/m^2 and is expected to cause about 3C of warming.
David, here's a graph of historical TSI:
http://spot.colorado.edu/~koppg/TSI/TIM_TSI_Reconstruction.png
And here are some data:
LASP, via IPCC AR5
http://lasp.colorado.edu/sorce/tsi_data/TSI_TIM_Reconstruction.txt
NOAA, via Lean (2000)
ftp://ftp.ncdc.noaa.gov/pub/data/paleo/climate_forcing/solar_variability/lean2000_irradiance.txt
The IPCC ARs say the climate's sensitivity to changes in total solar irradiance is about 0.1 C/(W/m2).
If use the zero-dimensional energy balance equation
(1-albedo)S/4 = epsilon*sigma*T^4
where S is TSI, then
dT/dS = T/4S ~ 0.05 degC/(W/2).
Thanks, David and Layzej.
Post a Comment