Wednesday, May 28, 2014

Obama's Proposal Equivalent to Only 6% Cut in Total CO2 Emissions

President Obama is going to propose CO2 cuts of up to 20 percent from coal-fired power plants. NY Times:
WASHINGTON — President Obama will use his executive authority to propose a global warming regulation that would cut carbon pollution from the nation’s coal-fired power plants by up to 20 percent and pave the way for the creation of state cap-and-trade programs without having to go through a reluctant Congress, according to people familiar with the rule.
That sounds big, and getting rid of 20% of coal in the U.S. would be a significant first step, but the CO2 problem is so large the overall impact isn't that impressive.

In 2013 the U.S. emitted 5,393 megatonnes of CO2 from burning fossil fuels, according to the EIA. Of that, 1,722 Mt was from burning coal.

So a 20% maximum reduction in the latter is only 344 Mt, or 6.4% of the total, maximum.

And it's about 1% of global emissions.

6% is much better than nothing. Do it 16 times and you're almost down to zero. But it just shows how enormously difficult it is to make climatologically meaningful cuts in carbon emissions. It's most meaningful impact may be the message, to the country and the world (especially the Chinese).

Tuesday, May 27, 2014

Colorado River Reaches the Sea

After the Minute 319 pulse flow out of the Morelos Dam in March, it was unclear if the Colorado River was going to reach the Sea of Cortez. But it did, on May 15th. Here's a nice satellite picture from NASA; another good one here.

pulse-flow-1_labels

It looks pretty sad, though.

A Burd Among Burdz

Bickmore's "Who are the alarmists here?"

Barry Bickmore has a great op-ed in the Deseret News, "Who are the alarmists here," in reply to a typical denier scoffer who gave all the typical denier scoffer myths, objections, mistakes, unthuths, misconceptions, etc. You should read it all, but this was especially good:


And this:

Read the full piece.

Monday, May 26, 2014

El Niño Having Trouble Getting it Up

Getting the Niño3.4 sea-surface temperature up, that is. This weeks' anomaly is just a tick above last week's, but nothing impressive:


Though it is above the Great El Niño Fake-Out of 2012:


Another indicator of its weakness is the Southern Oscillation Index, which is proportional to the normalized barometric pressure difference between Tahiti and Darwin, Australia, and which correlates with ENSOs. The Queensland Government publishes it daily.


A closer look shows it just dawdling along, after its fake jaunt earlier this year:

Saturday, May 24, 2014

The Energy Needed to Melt All This Ice

It takes energy to melt ice.

So if the world is losing over a trillion tonnes of ice a year, how much energy does that require?

It takes 334 kilojoules to melt a kilogram of ice -- or about 7,500 joules to melt an ice cube (1.5" x 1" x 1").

If it took three minutes to melt this ice cube, it'd require an average power of 42 Watts, which seems believable (as a check).

So melting 1,070 gigatons of ice a year requires 3.6e17 kJ/yr, or an average of 11 terawatts.

By contrast, human civilization now runs on about 16 TW.

Over the surface of the Earth, the energy to melt all this ice comes out to 0.02 Watts per square-meter -- or just a few percent of the Earth's current energy imbalance.

But it's a few percent, which isn't nothing.

With an ice density of about 900 kg/m3, this 1,070 Gt/yr of ice loss represents a decrease of about 1.2e12 cubic meters of water a year -- or 2.3 mm/yr over the entire Earth's surface.

There's your sea-level rise from ice melting -- about 2/3rds of the 3.2 mm/yr that is observed. The other third is due to the thermal expansion of water.

I like it when my numbers work out.

Correction 6/1/14:
A pair of errors in the above needs to be corrected; they just about cancel each other out.

As someone pointed out on Twitter, I mistakenly included sea ice in my calculation of sea-level rise, and also divided by the surface area of the Earth instead of the surface area of the ocean.

Subtracting out the sea ice gives a volume change of about 8.7e11 m3/yr. Over the Earth's ocean, that comes to a sea-level rise of 2.4 mm/yr.

I know, of course, that floating ice that melts doesn't change sea-level. Just barfed on this one.

The Invisible Hand

BeFunky_null_12.jpg

Via.

And They Say Irony is Dead

Eliot Rodger calls himself a "sophisticated gentlemen," then goes out and shoots 13 19 people.

And they say irony is dead. And that's not all.

China's CO2 Savings From Their Gas Deal with Russia

China just completed a huge deal with Russia for natural gas. How will it affect their CO2 emissions?

Not as much as you might think.

The 30-year, $400 billion deal is for 38 billion cubic-meters of gas annually for 30 years, "or about 20 percent of its sales to Europe." That's a total of 1,140 Bm3; by contrast, the US consumed 26,034 Bcf last year, or 737 Bm3.

The Chinese total will generate about 45 trillion megajoules of energy (an average power of 48 gigawatts), which will emit about 2.5 gigatons of CO2.

Generating that amount of energy with coal would emit 4.4 Gt CO2.

So over 30 years it only saves 1.9 Gt CO2, which is just 20% of China's 2012 emissions of 9,900 Mt CO2. It's less than 1% of what they will emit over 30 years.

China emits a lot of CO2. Every reduction helps, and this should definitely help their pollution problems. But it won't do a lot for global warming.

Friday, May 23, 2014

Hadley Centre: 2nd-warmest April; 10th-warmest Month

HadCRUT says April 2014 was the second-warmest April since 1850, +0.641°C above their baseline (1961-1990), and the 10th-warmest (above baseline) of any month.

Map of combined land-surface and sea-surface temperature anomalies from HadCRUT4


Thursday, May 22, 2014

Chance of Strong El Nino Declining

That's what Tony Barnston of Columbia University's International Research Institute on Climate and Society says -- the El Nino is developing right now, but could be of more moderate strength. He finds a probability it could die (like in 2012) of 25%:

 
May 2014 Climate Briefing Highlights, with Tony Barnston from IRI on Vimeo.

Here is their map of sea-surface temperatures, and below is the Nino3.4 sea-surface temperature anomaly updated for this week, compared to two recent El Ninos; you can see it has been having its own little hiatus, and took a dip down this week:


Via Andrew Revkin on Twitter.

Newsweek Author Clarifies on 1975 Global Cooling Story

At Philly.com, Peter Gwynne writes:
Several atmospheric scientists did indeed believe in global cooling, as I reported in the April 28, 1975 issue of Newsweek. But that was then.

In the 39 years since, biotechnology has flowered from a promising academic topic to a major global industry, the first test-tube baby has been born and become a mother herself, cosmologists have learned that the universe is expanding at an accelerating rate rather than slowing down, and particle physicists have detected the Higgs boson, an entity once regarded as only a theoretical concept. Seven presidents have served most of 11 terms. And Newsweek has become a shadow of its former self.

And on the climate front? The vast majority of climatologists now assure us that Earth's atmosphere is not cooling. Rather it's warming up. And the main responsibility for the phenomenon lies with human activity.
As my list here shows, there were plenty of scientific papers on CO2-warming by 1975, including major scientific reports. In fact, 1975 was when Manabe and Wetherald did their first calculation of climate sensitivity, obtaining a value of 2.9°C.

To his credit, Gwynne concludes:
Speaking personally, though, I accept that I didn't tell the full story back then. Indeed, the issue raises questions about the relationship between science writers and scientists as well as the attitudes toward science of individuals with political agendas.

Wednesday, May 21, 2014

Oregon Counties Vote to Ban GMOs

Two counties in southern Oregon voted yesterday to ban genetically modified crops.

 Jackson County's vote was 66-34; Josephine County's was 58-42.

I wonder what will happen when we get genetically modified people.

Meanwhile, Josephine County once again voted against funding their county jail, 52-48. As the Oregonian notes, it was "a bigger margin than the vote on a more costly measure a year ago." Some 911 calls have gone unanswered in the County
A woman was assaulted by her ex-boyfriend after she called 911 and tried to get an officer at her home.

Her call was transferred to the state police because the sheriff's department isn't staffed 24 hours a day or seven days a week, the station said. A dispatcher for the state police said, "Uh, I don't have anybody to send out there. You know, obviously, if he comes inside the residence and assaults you, can you ask him to go away?"
and the state may impose a special income tax on the county, since its residents don't much seem to care about anything, as long as their taxes are low.

Earth Losing a Trillion Tons of Ice a Year

At Slate, Phil Plait notes a new paper that finds the Antartic is losing 159 gigatonnes of land ice a year.

How does that compare to the increase in Antarctic sea ice, a favorite talking point of [fake] skeptics?

A new paper in the Journal of Climate models Antarctic sea ice and finds it increasing by 30 km3/yr. (There may, though, be problems with the algorithm that calculates the daily sea ice number; more on that here.) Since sea ice has a density of about 870 kg/m3, that's a gain of about 26 Gt/yr.

Note: that's only 1/10th the amount of loss in Arctic sea ice.

I looked up numbers for the rest of the world's ice:


Over a teratonne a year.

So unless the frozen bus stop puddles of the world are gaining over a 1,000 gigatonnes of ice a year -- doubtful even in Canada -- the world is definitely losing a lot of ice. And Greenland's loss is accelerating.

Sources: McMillan et al, Holland et al, PIOMAS, Enderlin et al, Gardner et al.

Correction 5/28: PIOMAS number changed from -300 Gt/yr because, while the volume change is -300 km3/yr, I didn't multiply by the density of sea ice to convert it to mass.

Tuesday, May 20, 2014

NOAA: April Tied for Warmest in Records


NOAA finds this April to be tied with 2010 for the warmest April in their records, +0.77°C above their baseline (1901-2000).
April temperature difference from average (NOAA)

Monday, May 19, 2014

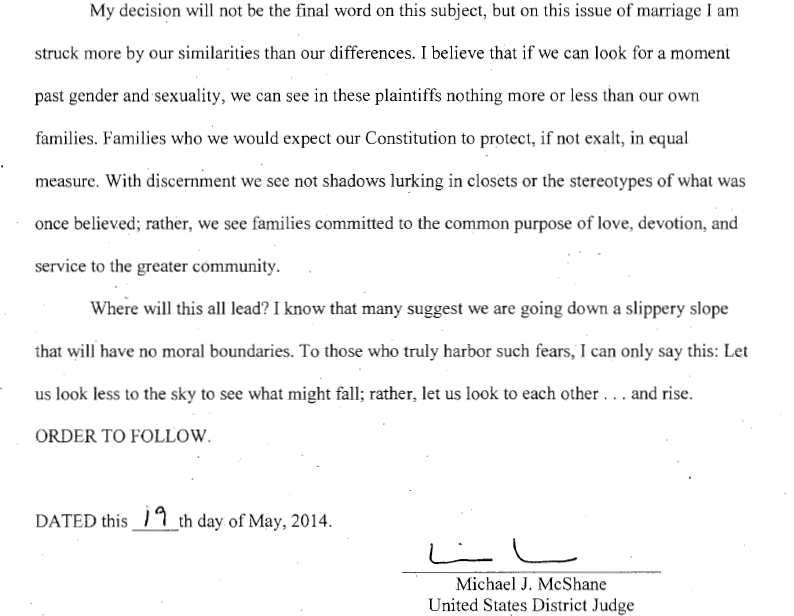
Federal Judge's Elegant Words on Striking Down Oregon's Definition of Marriage

Today U.S. District Judge Michael McShane ruled that Oregon's 2004 referendum that defined marriage as between one man and one woman is unconstutitional (essentially, a ban on same-sex marriage).

 His decision ends with a with these elegant and stirring words:


  Media preview

The marriages have already started.

Sunday, May 18, 2014

The University of Queensland Letter

Regardless of the John Cook data, IP issues, what they imply about the consensus on anthropogenic climate change and where the truth is, the legalistic heavy-handedness demonstrated by the University of Queensland to Brandon Shollenberger is...unnecessary and troubling.

Despite their threats against merely reproducing the cease and desist letter, Shollenberger went ahead and published it, and good for him. The letter is clearly of public and journalistic interest, so I've put a copy up at my Climate Document Storehouse, which maybe someday will be renamed The Repository of Wayward and Forbidden Documents. IMO, the letter deserves other mirrors as well.

The Upward Trend in New York City Storm Tides

Just published: "Increasing storm tides in New York Harbor, 1844–2013," S. A. Talke, Geophysical Research Letters. The abstract and two graphs:
Abstract
Three of the nine highest recorded water levels in the New York Harbor region have occurred since 2010 (March 2010, August 2011, and October 2012), and eight of the largest twenty have occurred since 1990. To investigate whether this cluster of high waters is a random occurrence or indicative of intensified storm tides, we recover archival tide gauge data back to 1844 and evaluate the trajectory of the annual maximum storm tide. Approximately half of long-term variance is anticorrelated with decadal-scale variations in the North Atlantic Oscillation, while long-term trends explain the remainder. The 10 year storm tide has increased by 0.28 m. Combined with a 0.44 m increase in local sea level since 1856, the 10 year flood level has increased by approximately 0.72 ± 0.25 m, and magnified the annual probability of overtopping the typical Manhattan seawall from less than 1% to about 20–25%.


Friday, May 16, 2014

Texas Panhandle: Driest 5 Years on Record

I can't prove it, but it strikes me that drought just might be the weather phenomenon that causes the most suffering of any. And Texas is having a dousy.

This graph is via Victor Murphy, an NWS Climate Service Program Manager. 

He also forwards this National Geographic News story, which goes so far as to describe the drought in western Texas, western Oklahoma, western Kansas and eastern Colorado "A New Dust Bowl."
The National Weather Service, measuring rain over 42 months, reports that parts of all five states have had less rain than what fell during a similar period in the 1930s.
And now all of California is in "severe drought."

Unlike hurricanes and tropical storms, we don't name droughts -- maybe we should -- but if we did, this one should obviously be called "Drought Inhofe." Whatever proportion of this drought isn't caused by climate change -- and higher temperatures themselves make droughts worse by increasing evaportion from lakes and soils -- he surely deserves it. Because ultimately, denying climate change comes down to denying human suffering.

Bengtsson Statement: No "Cover Up" in Climate Science

Lennart Bengtsson put up a statement today on The Times article. He disagrees with it:
Professor Lennart Bengtsson, professorial research fellow at the University of Reading, said:

“I do not believe there is any systematic “cover up” of scientific evidence on climate change or that academics’ work is being “deliberately suppressed”, as The Times front page suggests."
He continues:
"I am worried by a wider trend that science is being gradually being influenced by political views. Policy decisions need to be based on solid fact."
which is a very strange (naive?) thing for a climate scientist who had just joined a political organization to say.

The rest is here.

It will be interesting to see if The Times issues a correction. (Don't hold your breath.)