A must-read at RealClimate:
Wednesday, May 30, 2018
Does global warming make tropical cyclones stronger? « RealClimate

Sunday, May 27, 2018
Book: The Efficiency Paradox, by Edward Tenner
 In the mail: The Efficiency Paradox: What Big Data Can't Do, by Edward Tenner, published by Alfred A. Knopf, 2018.
From Publisher's Weekly:
Historian Tenner (Why Things Bite Back) argues that supposed advances in technological efficiency can actually be self-subverting in this reasoned antidote to a culture increasingly obsessed with doing more with less. He starts by examining the history of innovations premised on efficiency, first seen in continuous production models such as Ford’s assembly line, and more recently in the rise of digital platform companies, which are “based less on the organization of machines and human labor than the gathering, analysis, and exchange of data.” The book then segues into hot topics such as rideshare apps, GPS, and self-driving cars. Tenner demonstrates how systems such as these, which are premised on efficiency, reduce serendipity, stifle learning, and limit humans’ ability to respond when malfunction occurs; they also, he argues, create substantial lost opportunity cost in the long term. Tenner also addresses the fallacies of big data and how random initial advantages from algorithms (such as Google’s PageRank, which attempts to deliver information that people want rather than what they asked for) can hide the long-term codification of systemic bias. Tenner is no luddite; he evaluates the positives and negatives of technology through a strong base of evidence rather than nostalgia or personal anecdote, and debunks some of the most popular concerns about automation. Tenner’s insightful study of the effects of information technology on society warrants close attention.
Wednesday, May 23, 2018
Question About Human Vision and Missiles

(I know the diameter might not be realistic. I just wanted to make it an easy number.)
This is tangentially related to an article I'm working on.
Note added 5/27: I think my query was somewhat ambiguous, because the ability for the eye to track something depends on how far away it is. (Not too far, but not too close.) You can assume any distance you want.... For that matter, make any assumptions you want about size of the object being viewed.... What if the starship Enterprise (or Voyager) dipped into a planet's atmosphere? When could you see it and when would it be moving too fast to catch?
Tuesday, May 22, 2018
James Chadwick Accidentally Went Into Physics

"...James Chadwick, the discoverer of the neutron, had studied physics only because he was too shy to point out that he had mistakenly waited in the wrong line when matriculating."
From Warped Passages by Lisa Randall
Monday, May 21, 2018
Latest Ocean Heat Content Data
Global warming continues.
The data for ocean heat content for the first quarter of this year came out the other day for the global regions 0-700 meters and 0-2000 meters. They're warmer. Recall that changes in ocean heat content are the best way to detect the planet's energy imbalance -- over 90% of the heat trapped by our greenhouse gases finds it way into the ocean.
After some spreadsheet fun I get the following:

Lots of graphs can be found here.


(In my calculations I've only included the Argo data for the 0-2000 m region, which starts in 2005, shown in red in this last graph.)
The data for ocean heat content for the first quarter of this year came out the other day for the global regions 0-700 meters and 0-2000 meters. They're warmer. Recall that changes in ocean heat content are the best way to detect the planet's energy imbalance -- over 90% of the heat trapped by our greenhouse gases finds it way into the ocean.
After some spreadsheet fun I get the following:

W=watts, J=joules, m=meters; yrs=years; Z=zetta=1021; T=tera=1012.
Note that the 0-700 m record is almost 5 times longer than the 0-2000 m record, so even though it's about 3 times smaller (in volume) it's not too surprising it's absorbed more heat over its record length.
The uncertainties don't include autocorrelation -- the reality that one quarter isn't independent of the previous quarter, because a warm quarter is more likely to follow a warm quarter etc -- because I'm lazy and because I'm still not quite sure how to include it for the uncertainties of a 2nd-order polynomial fit. (Anyone know? Can you do it quick and dirty by using the effective sample size neff as in equation 9 of this document by Tom Wigley?)
Lots of graphs can be found here.


Friday, May 11, 2018
Crop Yields Under Global Warming
Up until now I thought that global warming would have a significant impact on crop yields, both in the US and elsewhere.
But I've gathered some numbers, and I'm so sure anymore -- at least for US farmers/farming corps.
My understanding was taken from papers like this one:
So how do crop yields (again, US-only) vary with temperature? Here are some data from the National Climate Assessment (2014), Figure 18.3, p 421

These data are, admittedly, rather scattered and a straight-line trend will have errors. (I don't have the underlying data to calculate those here.) But by eye, I estimate the trends to be, for corn: -0.39 t/ha/°F, and, for soybeans: -0.08 t/ha/°F.
So what are the current yields, and how fast are they increasing? Here is the current yield and trend in corn yields, and the same for soybean yields.
So, plugging in the data, the trend in corn yields = 1.9 bu/acre/yr, and the trend in soybean yields = 0.5 bu/acre/yr. Relative to 2017, these are 1.1%/yr and 1.0%/yr, respectively.
From the same source, 2017 yields are, for corn: 176.6 bu/acre, and for soybeans, 49.1 bu/acre. "bu" is bushels.
I need to know the density of corn and of soybeans: 39.3680 bu/t and 39.7740 bu/t, respectively, from this source.
Translating into metric units: 2017 corn yield = 11.1 t/ha, 2017 soybean yield = 3.1 t/ha.
OK, now we can put things together.
Let's assume the surface warming trend is +0.20°C/decade. That's one degree Celsius in 50 years. (Results for other trends will scale linearly.)
Assuming the current trend in yields continues (iffy?), in 50 years (a long time, granted), yields will have increased by 170% (for corn), and 165% (for soybeans).
But in that time, yields will only decrease due to higher temperature by -6% (corn) and -5% (soybeans).
So agricultural technology will, even if trends continue at only a fraction of their current value, swamp any losses due to global warming.
And it won't take much increase in yields in developing countries for them to cancel out any loses due to higher temperatures, either.
--
Of course, there's no inherent reason to believe that yield increases will continue at their rate of the last 30 years for the next 50 years. Nor will warming stay linear, probably. And we'll need more food to feed ever more people, about 10 B by the middle of this century. And warming won't be limited to just one degree Celsius (we're already at that value anyway).
But I don't anymore see a big problem here. Am I missing something?
But I've gathered some numbers, and I'm so sure anymore -- at least for US farmers/farming corps.
My understanding was taken from papers like this one:
“For wheat, maize and barley, there is a clearly negative response of global yields to increased temperatures. Based on these sensitivities and observed climate trends, we estimate that warming since 1981 has resulted in annual combined losses of these three crops representing roughly 40 Mt or $5 billion per year, as of 2002.”and this one
-- “Global scale climate–crop yield relationships and the impacts of recent warming," David B Lobell and Christopher B Field 2007 Environ. Res. Lett. 2 014002 doi:10.1088/1748-9326/2/1/014002
http://iopscience.iop.org/1748-9326/2/1/014002
“With a 1°C global temperature increase, global wheat yield is projected to decline between 4.1% and 6.4%. Projected relative temperature impacts from different methods were similar for major wheat-producing countries China, India, USA and France, but less so for Russia. Point-based and grid-based simulations, and to some extent the statistical regressions, were consistent in projecting that warmer regions are likely to suffer more yield loss with increasing temperature than cooler regions.”But -- again, for the US -- these turn out to be quite small numbers, because the market sizes are so big and yields are increasing year-after-year.
- B. Liu et al, “Similar estimates of temperature impacts on global wheat yields by three independent methods, Nature Climate Change (2016) doi:10.1038/nclimate3115, http://www.nature.com/nclimate/journal/vaop/ncurrent/full/nclimate3115.html
So how do crop yields (again, US-only) vary with temperature? Here are some data from the National Climate Assessment (2014), Figure 18.3, p 421

So what are the current yields, and how fast are they increasing? Here is the current yield and trend in corn yields, and the same for soybean yields.
So, plugging in the data, the trend in corn yields = 1.9 bu/acre/yr, and the trend in soybean yields = 0.5 bu/acre/yr. Relative to 2017, these are 1.1%/yr and 1.0%/yr, respectively.
From the same source, 2017 yields are, for corn: 176.6 bu/acre, and for soybeans, 49.1 bu/acre. "bu" is bushels.
I need to know the density of corn and of soybeans: 39.3680 bu/t and 39.7740 bu/t, respectively, from this source.
Translating into metric units: 2017 corn yield = 11.1 t/ha, 2017 soybean yield = 3.1 t/ha.
OK, now we can put things together.
Let's assume the surface warming trend is +0.20°C/decade. That's one degree Celsius in 50 years. (Results for other trends will scale linearly.)
Assuming the current trend in yields continues (iffy?), in 50 years (a long time, granted), yields will have increased by 170% (for corn), and 165% (for soybeans).
But in that time, yields will only decrease due to higher temperature by -6% (corn) and -5% (soybeans).
So agricultural technology will, even if trends continue at only a fraction of their current value, swamp any losses due to global warming.
And it won't take much increase in yields in developing countries for them to cancel out any loses due to higher temperatures, either.
--
Of course, there's no inherent reason to believe that yield increases will continue at their rate of the last 30 years for the next 50 years. Nor will warming stay linear, probably. And we'll need more food to feed ever more people, about 10 B by the middle of this century. And warming won't be limited to just one degree Celsius (we're already at that value anyway).
But I don't anymore see a big problem here. Am I missing something?
Sunday, April 01, 2018

Tuesday, March 27, 2018
Will the Falling Chinese Satellite Hit Someone?
 As you probably know, the de-orbiting Chinese space station Tiangong-1 will soon fall to Earth.
This thing is 10.4 meters long and, on launch, weighted 8.5 tonnes.
What are the chances it will hit someone, or something important?
I don't know, and now that I'm reviewing this calculation I feel pretty sure I don't know, but here goes with my original idea.
The satellite will fall between the ± 43° latitude lines. But that's about all that seems known for sure right now.
That area constitutes 348 Mkm2, or 68% of Earth's surface area.
Much of this is ocean, but I don't know exactly how much. I'll assume, for better or worse, that it's the same percentage that the ocean makes up of Earth's total surface area, 70.8%, giving a potential land fall area of 102 Mkm2.
How many people are in this area? I don't know. All I know to do (without a lot of work) is assume it's the same percentage of the world population as is land, which, extrapolating this trend, was 7.46 B in 2017.
(Amazingly, 90% of the world's people live in the Northern hemisphere.)
When might a person be "hit" by a falling satellite? Let's say if it occurs within a 10 m radius of that person. Thus the danger zone around each person is 628 m2, and around all people living in the fall zone is (assuming independence) 3.20 Mkm2.
That's 3.1% of the satellite's potential landing zone. Small, but not tiny.
--
I suspect this number is an overestimate, because
(1) I've overestimated the number of people who live between -43 and +43 degrees latitude, since there's more ocean there than I've assumed, and
(2) I've assumed each person's "target zone" is independent of everyone else's (which is obviously not true in cities.)
Much of Europe and Russia lives above 43° N latitude, and all of Canada does -- and I do too, at 45-epsilon degrees. (I often drive past the a sign in North Salem announcing the 45° line, and based on my home's GPS coordinates I've calculated that I'm about 4.4 km south of this line, or at 44.960858° north latitude.)
So, there's a tiny chance of someone being hit by this satellite. 3% seems high -- but I doubt the chances are infinitesimal, even if I'm off by a factor of 10.
Still, good luck out there. Heads up.
Free, Online Climate Textbooks
I've recently come across a few free, online climate textbooks, and thought it worth mentioning here.
A great introduction to the basics:
Introduction to Climate Science, Andreas Schmittner, Oregon State University.
For more advanced students:
Introduction to climate dynamics and climate modeling, by Goosse H., P.Y. Barriat, W. Lefebvre, M.F. Loutre and V. Zunz, (2008-2010).
I guess I can mention Pierrehumbert's textbook Principles of Planetary Climate, though I'm not sure it's on the Web legally. I bought the hardback version and have learned a great deal from it. I heartily recommend it.
A great introduction to the basics:
Introduction to Climate Science, Andreas Schmittner, Oregon State University.
For more advanced students:
Introduction to climate dynamics and climate modeling, by Goosse H., P.Y. Barriat, W. Lefebvre, M.F. Loutre and V. Zunz, (2008-2010).
I guess I can mention Pierrehumbert's textbook Principles of Planetary Climate, though I'm not sure it's on the Web legally. I bought the hardback version and have learned a great deal from it. I heartily recommend it.
Sunday, March 18, 2018
My Plastic Brain by Caroline Williams
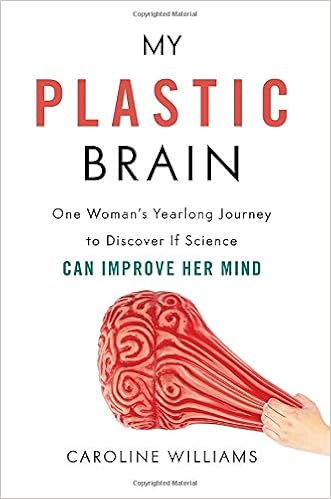 From my mailbox:
My Plastic Brain: One Woman's Yearlong Journey to Discover If Science Can Improve Her Mind by Caroline Williams.
Amazon
Barnes and Noble
Author's Web site
From Kirkus Reviews:
"Readers hoping to improve their own cognitive abilities may feel a bit of a letdown by the author’s old-fashioned, down-to-earth advice: exercise your body, preferably outdoors, learn mindful meditation but also allow your mind to wander, engage in a mentally challenging hobby, and pick the skill you want to improve and practice it in real life."
Valar morghulis.
Thursday, March 15, 2018
Monday, March 12, 2018
When the Statue of Liberty Gets Sea Walls
Last night I started watching The Expanse on Amazon Prime. It's been really good scifi so far, and has that nitty-gritty view of future space travel, more Firefly than Star Trek, but even grittier. It's set 200 years in the future, and in an early episode there was this short cut of the Statue of Liberty, with sea walls due to (presumably) global warming:

Another good idea (for the story, at least) was "gravity torture," where those who grew up off-Earth in a lower gravitational environment are tortured by being hung in Earth's gravity for hours:

In Kim Stanley Robinson's Mars Trilogy, kids born on Mars (where g = 38% of that of Earth) eventually become significantly taller than Earthlings.
I appreciate when writers think about the little things and subtly put them in their stories. It's fun to notice them. The Expanse does this very well, so far.

Another good idea (for the story, at least) was "gravity torture," where those who grew up off-Earth in a lower gravitational environment are tortured by being hung in Earth's gravity for hours:

In Kim Stanley Robinson's Mars Trilogy, kids born on Mars (where g = 38% of that of Earth) eventually become significantly taller than Earthlings.
I appreciate when writers think about the little things and subtly put them in their stories. It's fun to notice them. The Expanse does this very well, so far.
Sunday, March 11, 2018
Question About My Blog's Appearance
When you read this blog, is the page too wide for your screen?
Do you have to scroll right in order to see what's beyond the post itself -- the "About Me" module, "Blog Archive," "Good Links," etc.?
I do. So I'm wondering if everyone has the same problem. Other blogspot blogs read fine in my browser.
Thanks.
Do you have to scroll right in order to see what's beyond the post itself -- the "About Me" module, "Blog Archive," "Good Links," etc.?
I do. So I'm wondering if everyone has the same problem. Other blogspot blogs read fine in my browser.
Thanks.
Thursday, March 01, 2018
Equations That Changed the World
A few years ago, mathematician Ian Stewart published a book titled 17 Equations That Changed The World. It's an interesting list:

I would go beyond these 17 and add:
- 1+1=2, which some unknown someone realized long ago was profound and incredibly useful. The logical proof of this assertion, though, didn't come until Bertrand Russell and Alfred North Whitehead three-volume Principia Mathematica. It's a crazy book -- the text looks almost alien or elvish, and it took them several hundred pages of work before they could prove that 1+1=2. Russel said his work on this book "had actually damaged his brain." Here's an interesting discussion of the Principia Mathematica from NPR in 2010.
- Newton's second law of motion, F=ma (really, F=dp/dt, the time rate of change of momentum).
- Planck's Law of radiation (probably).
- The Lagrangian of quantum electrodynamics, because it changed how quantum physics was done ever afterward.
- Einstein's equations of general relativity, because they changed our view and understanding of the universe, and for their sheer elegance and sophistication.
Tuesday, February 27, 2018
Idiocy from Ed Berry, PhD
What can you even do when climate deniers won't agree to the basic rules of arithmetic??
Ed Berry is a physicist who earned his PhD back in the Mesozoic era. From Caltech, no less. He now lives in Montana as a mountain man, battling long-horned sheep for food, coming into town once a year for saltpeter and a ballot.
Ed is a hard core climate denier. (And, naturally, a hard core Trump supporter.) So hard core he doesn't care when he makes basic, boneheaded mistakes -- because, you know, one never admit error when a bear is charging at you, or someone who understands the science.
Q: How much has atmospheric CO2 increased since the pre-industrial era?
A: That's an easy calculation, right?
That's simple, clearly.... But not in Ed's denier-land. This is from Ed's blog:

30%?? Whoa.... That's just a dumb arithmetic error. It comes from calculating
which is obviously NOT how to calculate a percentage change. You and I learned this in 5th or 6th grade. So did Ed. It's a trivial, arithmetic error.
But one that mountain men will not admit to. Ed is so much of an uber denier that he can't even admit to a simple arithmetic error, can't say, Oops!, you're right, let me fix this and go on.
Now, what can you do when a denier won't accept arithmetic?? I have no idea.
It's all part of Ed's Big Misunderstanding -- he writes, "Why human CO2 does not change climate." He's so sure of this, of course, just as he's sure that the increase in atmospheric CO2 is 30%, even though every 6th grader knows better. He's submitted a paper somewhere (he won't say where), and is proud that after 4 months it hasn't yet been rejected. Remarkable!
Sorry, but I don't accept PhDs in physics misunderstanding the basic science behind global warming -- the Earth emits infrared radiation, and the atmospheric GHGs absorb it. Rejecting that is bad enough. But claiming that our HUGE emissions of CO2 aren't piling up in the atmosphere -- somewhere -- that's is just, I'm sorry, pure stupidity. Dumb. Ignorant. Idiotic.
But what can you do when deniers won't accept the basic rules of arithmetic? Where do you even start?? Beats me....
Ed Berry is a physicist who earned his PhD back in the Mesozoic era. From Caltech, no less. He now lives in Montana as a mountain man, battling long-horned sheep for food, coming into town once a year for saltpeter and a ballot.
Ed is a hard core climate denier. (And, naturally, a hard core Trump supporter.) So hard core he doesn't care when he makes basic, boneheaded mistakes -- because, you know, one never admit error when a bear is charging at you, or someone who understands the science.
Q: How much has atmospheric CO2 increased since the pre-industrial era?
A: That's an easy calculation, right?
That's simple, clearly.... But not in Ed's denier-land. This is from Ed's blog:

30%?? Whoa.... That's just a dumb arithmetic error. It comes from calculating
change/final_amount = (408 ppm - 280 ppm)/408 ppm = 31%
which is obviously NOT how to calculate a percentage change. You and I learned this in 5th or 6th grade. So did Ed. It's a trivial, arithmetic error.
But one that mountain men will not admit to. Ed is so much of an uber denier that he can't even admit to a simple arithmetic error, can't say, Oops!, you're right, let me fix this and go on.
Now, what can you do when a denier won't accept arithmetic?? I have no idea.
It's all part of Ed's Big Misunderstanding -- he writes, "Why human CO2 does not change climate." He's so sure of this, of course, just as he's sure that the increase in atmospheric CO2 is 30%, even though every 6th grader knows better. He's submitted a paper somewhere (he won't say where), and is proud that after 4 months it hasn't yet been rejected. Remarkable!
Sorry, but I don't accept PhDs in physics misunderstanding the basic science behind global warming -- the Earth emits infrared radiation, and the atmospheric GHGs absorb it. Rejecting that is bad enough. But claiming that our HUGE emissions of CO2 aren't piling up in the atmosphere -- somewhere -- that's is just, I'm sorry, pure stupidity. Dumb. Ignorant. Idiotic.
But what can you do when deniers won't accept the basic rules of arithmetic? Where do you even start?? Beats me....
Thursday, February 22, 2018


That Arctic Has Been Astonishingly Warm
This is an astonishing graph:


The Arctic is currently about 17°C (31°F) degrees above normal. The baseline (green line) is the 1958-2002 average.
If that were happening where I live, today's high would have been 86°F. Normal high (1981-2010) for Salem, Oregon today is 53°F.
Reflecting this, Arctic sea ice has already reached a record low for the year, 2.5% below last year's record low.
Saturday, February 17, 2018
Cool Integral
From KarlMagnus Petersson on Twitter:

In the same way, you can show (I think) that

which is also cool, but not as cool, since "3" is not as cool as "e."
Note: 1/3 < 1/e. This makes sense, since for 0 < x <1, sqrt(x) < cuberoot(x) < fourthroot(x), etc.
Note II: Speaking of e, one of my best friends, a colleague in graduate school (we had the same advisor, and have gotten even closer since), once wrote a paper that contained the number e^e, which I think is about the coolest thing ever published in physics. I wrote about it here for Physics World.

In the same way, you can show (I think) that

which is also cool, but not as cool, since "3" is not as cool as "e."
Note: 1/3 < 1/e. This makes sense, since for 0 < x <1, sqrt(x) < cuberoot(x) < fourthroot(x), etc.
Note II: Speaking of e, one of my best friends, a colleague in graduate school (we had the same advisor, and have gotten even closer since), once wrote a paper that contained the number e^e, which I think is about the coolest thing ever published in physics. I wrote about it here for Physics World.
Wednesday, February 07, 2018
Global Warming in Ursula Le Guin's 1969 Novel "The Left Hand of Darkness"
The science fiction writer Ursula Le Guin recently died (she lived in Portland, Oregon for decades), and since I hadn't read anything by her I thought I better get started. So I picked The Left Hand of Darkness, her breakthrough book published in 1969. She was on the ball, because even then she knew about CO2 and global warming. Here she writes about her fictional planet of Gethen.
Eskichwe rem ir Her hypothesized that the volcanic activity in N.W. Orgoreyn and the Archipelago has been increasing during the last ten or twenty millennia, and presages the end of the Ice, or at least a recession of it and an interglacial period. CO2 released by the volcanoes into the atmosphere will in time serve as an insulator, holding in the longwave heat-energy reflected from the earth, while permitting direct solar heat to enter undiminished. The average world temperature, he says, would in the end be raised some thirty degrees, till it attains 72°. I am glad I shall not be present. Ai says that similar theories have been propounded by Terran scholars to explain the still incomplete recession of their last Age of Ice. All such theories remain largely irrefutable and unprovable; no one knows certainly why the ice comes, why it goes. The Snow of Ignorance remains untrodden.It's interesting that she associated CO2 warming with the Ice Ages, as science did for a good while back then, I think, while it grappled with understanding the Pleistocene.
Subscribe to:
Posts (Atom)