
Wednesday, October 31, 2018

Tuesday, October 30, 2018
Sea Level Rise Committment
I've heard of warming commitment -- how much more the surface will warm if we stopped emitting greenhouse gases immediately (it's about 0.5°C), but until this video titled "This is the scariest graph I've ever seen," I had missed this result for sea level rise commitment -- how much sea level rise is "baked in" to the climate system if we stopped emitting GHGs today.
This 2016 paper by Hardy and Nuse finds the following for sea level rise commitment (SLRC):

It's difficult to imagine we will stay on RCP 8.5 until 2100 -- business as usual. But RCP 4.5, which does look imaginable, still has about 3.5 m of SLR, which is 11.5 ft, which already will a huge amount of damage.
There's a lot more to say about this paper, which I hope to do in the near future.
By the way, this Levermann et al 2013 paper finds a SLRC of 2.3 m/°C over the next 2000 years. Smaller than I thought.
PS: The current first comment on that Youtube video is a good one:

This 2016 paper by Hardy and Nuse finds the following for sea level rise commitment (SLRC):

(Click for a clearer image.)
There's a lot more to say about this paper, which I hope to do in the near future.
By the way, this Levermann et al 2013 paper finds a SLRC of 2.3 m/°C over the next 2000 years. Smaller than I thought.
PS: The current first comment on that Youtube video is a good one:

Saturday, October 27, 2018

Friday, October 26, 2018

Thursday, October 25, 2018
Various Stuff
Microplastics reach the top of the food chain. Tiny plastic particles (from 50 μm to 5 mm in diameter) have been found in human poop. That means we're eating or ingesting them from the air (as in the breakdown of synthetic fabrics, breakdown of larger debris like bottles, and from plastic beads in some cosmetics). The sample size was 8, all living in Europe or Asia. All of them produced contaminated poop. Obviously much more work is called for, such as figuring out how much of the plastic remains in the body, where it goes, if it's toxic, and if even smaller plastic particles are "able to penetrate the gut lining and enter the circulatory system and other organs, such as has been found to happen with other nanosize, man-made particles." Lovely. I'd like to think this might deter people from being irresponsible in disposing of plastics, but we all know that won't happen until we're shitting out gallon juice jugs into the toilet.
DeSmogBlog has an article listing many of the climate deniers running for office this November. Probably not all. Obviously all Republicans, except for one North Carolina Democrat who avoided the question in a debate. The question I wish the media would start asking is, "what is the cost of not addressing climate change?" Stop asking if they believe in it or not. That's like asking if they believe in gravity and hearing someone say "no." AGW is a given.
In Zen and the Art of Motorcycle Maintenance, the author, in a discussion with someone, argues that gravity didn't exist until Isaac Newton. I took it he meant the concept of gravity, not the actual curvature of spacetime. That's a book I should put on my list to read again soon.
A 2003 paper by the physicist Brian Josephson (Nobel Laureate for work he did when he was 22 years old) has the title, "We Think That We Think Clearly, But That's Only Because We Don't Think Clearly."
DeSmogBlog has an article listing many of the climate deniers running for office this November. Probably not all. Obviously all Republicans, except for one North Carolina Democrat who avoided the question in a debate. The question I wish the media would start asking is, "what is the cost of not addressing climate change?" Stop asking if they believe in it or not. That's like asking if they believe in gravity and hearing someone say "no." AGW is a given.
In Zen and the Art of Motorcycle Maintenance, the author, in a discussion with someone, argues that gravity didn't exist until Isaac Newton. I took it he meant the concept of gravity, not the actual curvature of spacetime. That's a book I should put on my list to read again soon.
A 2003 paper by the physicist Brian Josephson (Nobel Laureate for work he did when he was 22 years old) has the title, "We Think That We Think Clearly, But That's Only Because We Don't Think Clearly."
Did Dinosaurs Sleep?
Last night I was reading Dark Matter and the Dinosaurs by Lisa Randall (it's good, not great), and suddenly wondered 'did the dinosaurs sleep?' It never occurred to me before to ask. After a little Googling I found this great picture of the dinosaur Mei long, discovered in 2004, in what sure looks like a sleeping position:

This is a juvenile, about 53 cm long. Another sleeping Mei long fossil was discovered in 2012, but it's not as clear as the above picture.
I'm not sure why, but seeing this picture was somehow soothing, realizing that some dinosaurs, at least, had some peace (maybe) in a red-in-tooth-and-claw world. Did the brontosaurus sleep? How, on its side? If so, how would it ever get up? Maybe it slept standing up, perhaps in water to relax its muscles some? What about Tyrannosaurus Rex? Did he lay down and, when he woke, did he push himself up with his tiny little arms? If he laid down, did his body mass nearly crush his torso? Elephants, who only sleep about 2 hours a day (because they need to find so much food every day) sleep both standing up and lying down. So their body mass, as least, doesn't crush them. There are too many interesting things to learn about.

This is a juvenile, about 53 cm long. Another sleeping Mei long fossil was discovered in 2012, but it's not as clear as the above picture.
I'm not sure why, but seeing this picture was somehow soothing, realizing that some dinosaurs, at least, had some peace (maybe) in a red-in-tooth-and-claw world. Did the brontosaurus sleep? How, on its side? If so, how would it ever get up? Maybe it slept standing up, perhaps in water to relax its muscles some? What about Tyrannosaurus Rex? Did he lay down and, when he woke, did he push himself up with his tiny little arms? If he laid down, did his body mass nearly crush his torso? Elephants, who only sleep about 2 hours a day (because they need to find so much food every day) sleep both standing up and lying down. So their body mass, as least, doesn't crush them. There are too many interesting things to learn about.
Sunday, October 21, 2018
Picture of a Human Tear Drop
Below is a picture of a pizza human tear drop, by Norm Barker of the Johns Hopkins School of Medicine, Department of Pathology & Art as Applied to Medicine, a winner in Nikon’s micro-photo competition, and published in the Washington Post.
The Post published several more winners, but most are of more complicated, biological lifeforms. As a physicist, this one appeals to me for its relative simplicity and symmetry. But I wonder what the patterned lengthy objects are -- salt crystals? Any ideas? Why aren't there many in the center?

The Post published several more winners, but most are of more complicated, biological lifeforms. As a physicist, this one appeals to me for its relative simplicity and symmetry. But I wonder what the patterned lengthy objects are -- salt crystals? Any ideas? Why aren't there many in the center?
Saturday, October 20, 2018
"The Expanse" Season 3 on Amazon Prime Nov. 15th

Yeah -- season three of The Expanse is coming to Amazon Prime (without extra fees) on November 15th.
This is IMO the best sci-fi show since Star Trek: Enterprise, and every bit as good as Firefly, so mark your calendar. And you might want to watch season two again to recall the plotline.
Friday, October 12, 2018
What Percentage of Arctic Sea Ice is Gone?
 Over six years ago (omg) I wrote about the percentage loss of Arctic sea ice, by volume, and came up with a nice little formula to calculate it under the assumption of a linear trend.
It was, then, -39.0% gone since Jan 1979.
Now it's just over six years later, and I just wanted to note that, as of Sept 2018, the figure is now -47.3%. Arctic sea ice is disappearing at over 1% per year.
Using the linear trend of -306 km3/yr, the sea ice volume loss since Jan 1979 is now -12.2 Kkm3, or -10.6 trillion tonnes.
Using a quadratic fit (easily better, in the least-squares sense), the loss is accelerating at -11.2 km3/yr2.
By the way, this acceleration is down from a (negative) peak of -22.2 km3/yr2 in Nov 2012. Sea ice loss is stalling a bit. It's done this before, and is no big deal -- there is no scientific reason to expect it will continue forever.
Nordhaus
 |
| William Nordhaus |
First, because it highlighted the importance of the impacts of climate change, and also because (and no one I read mentioned this) it was kind of a slap across the face of Republicans.
Nordhaus was an architect of cap-n-trade, back when Republicans at least pretended to care about climate change, in the GHW Bush administration. Cap-n-trade was then seen as the free market solution to global warming. It didn't come to much, but is still often the preferred method of addressing climate change (as in Oregon), because, as far as I can tell, it allows politicians to put real caps on greenhouse emissions, and because it doesn't involve the word "tax," as in "carbon tax."
Nordhaus now thinks a carbon tax is superior. My impression is that now a carbon tax (revenue neutral, possibly with a dividend) is seen as the most efficient program. But it's still seen as a tax, and changing the wording to "carbon fee" doesn't seem to fool anyone.
Anyway, a few years ago I read Nordhaus's book The Climate Casino. I have to admit I didn't get a lot out of it. He didn't get into the guts of explaining his DICE model, which is what I was looking for, but maybe not the general reader.
I try to understand economics when I come across it, but a few things get in my way. I am terrible at understanding graphs like this one -- I don't know if I have a mental block or what, but I always have to think hard to puzzle my way through them.
What could be simpler, right? But by now I partly freeze-up when I see one, just due to anxiety from past anxieties, and have to overcome that to see what the graph says. Dumb.
But I do like collecting economics data from FRED.org, and looking for trends and changes.
It bothers me that economists never put error bars or uncertainty bands on their results. I'm guessing that's because it's hard enough to just get a model -- in the case of environmental economics, just to come up with basic equations that relate economic observables to climate observables -- let alone to worry about the uncertainties. This seems, to me, to imply that env econ results are far more precise than they really are.
Also, I've always found the equations economists come up with to be exceptionally ugly. At least compared to those of physics. They're full of asterisks and twiddles (tildes) and hats (carets) and primes, and subscripts high and low. Even subscripts on subscripts. They're just a mess. Here's an example of what I mean, from a more-or-less random paper I found by Paul Krugman:

Really?? And there are worse.
Anyway, I heard Nordhaus being interviewed on the radio the other day when I was driving somewhere, and he seemed like the nicest, most gentle guy anywhere.
Monday, October 01, 2018
Tangier Island Again
This news story about Tangier Island's jetty approval has a accompanying video (I guess that's de rigueur now, for people who can't or won't read) that's shot from a helicopter, so it gives a good sense of the island and the homes and businesses there. It looks...flat.
Wednesday, September 26, 2018
Sharp SST Spike Upward to an El Nino State
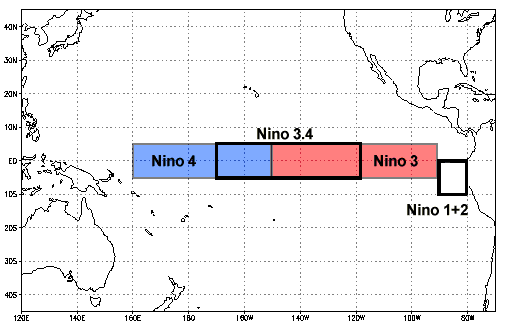
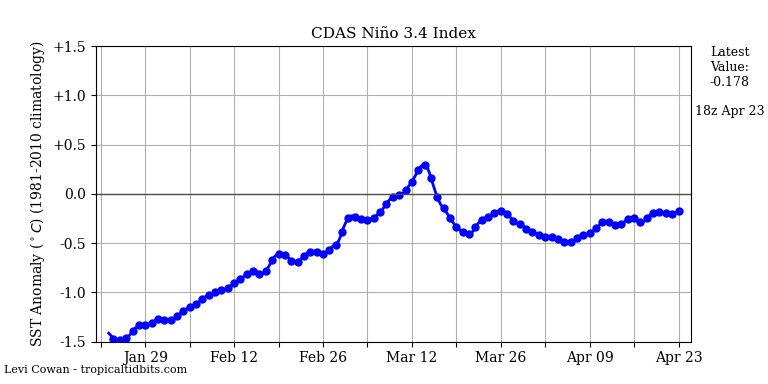
Here's an unusual change -- a sharp increase in the sea surface temperature anomaly of the Nino34 region in the central Pacific Ocean -- the region taken to be most indicative of the ENSO state. The anomaly is now in El Niño territory, as it's above 0.5°C. (It takes 5 months being above this value to make an official El Niño, in the eyes of NOAA.)


So no El Niño yet, but still a impressive spike.
Tuesday, September 25, 2018
Novel Graphic on Arctic Sea Ice Extent
From "Changing state of Arctic sea ice across all seasons," Julienne Stroeve and Dirk Notz, Environmental Research Letters, Vol 13, N 10, 24 Sept 2018 (open access).

(click to enlarge). The world is now emitting about 40 Gt CO2 per year (including land use changes), so we'll get to the first threshold, about 700 Gt CO2 (RCP 2.6) relative to today, in about 18 years.
(Since 1850 the world has emitted about 2,200 Gt CO2, about 70% from burning fossil fuels and 30% from land use changes.)

(click to enlarge). The world is now emitting about 40 Gt CO2 per year (including land use changes), so we'll get to the first threshold, about 700 Gt CO2 (RCP 2.6) relative to today, in about 18 years.
(Since 1850 the world has emitted about 2,200 Gt CO2, about 70% from burning fossil fuels and 30% from land use changes.)
Saturday, September 22, 2018
This is Mind-Blowing
If you follow the tinyurl link you can see how the breakoff point is derived: it's exp(99).Sometimes you check just a few examples and decide something is always true. But sometimes even 9.8 × 10⁴² examples is not enough!!!@gregeganSF and I came up with this shocker here on Twitter. To see what's really going on, visit my blog:https://t.co/Yw0S0Iyyx9 pic.twitter.com/1FThY9skeZ— John Carlos Baez (@johncarlosbaez) September 21, 2018
Thursday, September 20, 2018
About Time
"The darkness returns to Werner’s eyes, and he feels faint. Soon his legs will give out. A cat sits in the road licking a paw and smoothing it over its ears and watching him. He thinks of the old broken miners he’d see in Zollverein, sitting in chairs or on crates, not moving for hours, waiting to die. To men like that, time was a surfeit, a barrel they watched slowly drain. When really, he thinks, it’s a glowing puddle you carry in your hands; you should spend all your energy protecting it. Fighting for it. Working so hard not to spill one single drop."
All the Light We Cannot See
by Anthony Doerr
NOAA Race Track Graph
Here's where 2018's year-to-date GMST* stands compared to recent years, with some scenarios to the end of the year. Via NOAA. It's possible the four warmest years on record will be the last four years.
* global mean surface temperature

* global mean surface temperature

Saturday, September 15, 2018
Leap Year Days in 365-day Moving Average of a Time Series?
 Suppose you have a data time series that is taken every day. Say, like Arctic sea ice extent from NSIDC.
Let's say you want to calculate it's moving annual average -- over 1-yr, 12-mths, 365.25 days.
How, exactly, do you account for leap year days in such a moving average?
PS: I was born on a leap year day, February 29th -- the only baby in the hospital to have been delivered on that day -- but don't worry about upsetting me no matter whatever you propose. I've heard all the jokes, and I like being only a decade and a half old, more or less. It makes me feel just a bit special.
PPS: I also defended my PhD thesis on a Feb 29th. After my hour-long 4:00 pm presentation they voted me up just one hour before the hour I was born, so I can say I got my Phd when I was 27.


"The riskiest vaccine? The one that is not given."
I like this: "The riskiest vaccine? The one that is not given," Science 4/27/17.
bit.ly/2xks33L. "Two of every three alleged injuries related to vaccines have been dismissed over the past 30 years by the US's vaccine court."
Did you even know we had a vaccine court? The video explains more about it.
Certainly better than that immature idiot, Ross Douthat, who can't wait to turn the US into a theological state.
bit.ly/2xks33L. "Two of every three alleged injuries related to vaccines have been dismissed over the past 30 years by the US's vaccine court."
Did you even know we had a vaccine court? The video explains more about it.
--
Bret Stephens, the conservative columnist the NY Times took on a while back from the WSJ, got plenty of grief when he first came on because of his (rather mild, it turned out) position on anthropogenic global warming. But I think the people who judged him prematurely got it wrong -- Stephens has written a lot of good columns in recent months & weeks, about Trump, and including this one about China's heavy-handed oppression of Uighur Muslims. I'm finding that I agree with him more often than I disagree, and that he makes his points quite elegantly.Certainly better than that immature idiot, Ross Douthat, who can't wait to turn the US into a theological state.
--
Antarctic sea ice is currently the lowest of any Sept 14th in the satellite era, going back to 1979.
Friday, September 14, 2018
An El Nino Watch is in Effect
The odds of an El Nino this winter have gone up slightly -- the September outlook for ENSO now has an El Nino Watch, according to the CPC/IRI* outlook, which calls for "a 50-55% chance of El Niño development during fall, rising to 65-70% for winter 2018-19. An El Niño watch is in effect."
*Climate Prediction Center/International Research Institute for Climate and Society at Columbia University
These back-to-back (-to-back-to-(maybe) back) nonneutral years aren't as uncommon as I thought. In fact, 47 of 68 (69%) ENSO seasons since 1950-51 (July-June) have been classified as a nonneutral year, according to the ONI index. NOAA considers a season to be an El Nino if there are 5 or more consecutive months of a +0.5°C Nino3.4 Index (the temperature anomaly in the Nino3.4 region), and a La Nina if there are 5 or more consecutive months with an anomaly of -0.5°C or less.
This page explains more, including how they classify weak, moderate and strong seasons.
There's basically no trend in the annual average Nino3.4 Index since 1950-51: it's -0.02°C/decade.
*Climate Prediction Center/International Research Institute for Climate and Society at Columbia University
These back-to-back (-to-back-to-(maybe) back) nonneutral years aren't as uncommon as I thought. In fact, 47 of 68 (69%) ENSO seasons since 1950-51 (July-June) have been classified as a nonneutral year, according to the ONI index. NOAA considers a season to be an El Nino if there are 5 or more consecutive months of a +0.5°C Nino3.4 Index (the temperature anomaly in the Nino3.4 region), and a La Nina if there are 5 or more consecutive months with an anomaly of -0.5°C or less.
This page explains more, including how they classify weak, moderate and strong seasons.
There's basically no trend in the annual average Nino3.4 Index since 1950-51: it's -0.02°C/decade.
Subscribe to:
Posts (Atom)