Tuesday, January 29, 2019

Elon Musk's Carbon Footprint

WaPo calculated that Elon Musk flew 150,000 miles last year in his private jet. Let's calculate estimate his carbon footprint.

Musk flies in a Gulfstream G650 ER private jet, a top of the line airplane. It has a cruising speed of 890 km/hr. I'll assume this speed for all of his flying time, though of course it's lower during takeoffs and landings, or "short" trips at lower altitudes, etc. We're just doing an estimate here, a lower limit.

So Musk spent at least 271 hours flying privately last year. That's 11 days, or 3.1% of the year.

Musk may have flown with family and friends, but since the trip was being taken at his behest, he alone owns all the fuel burned and carbon emitted.

I couldn't find fuel data for the Gulfstream G650 ER, but did find this for the Gulfstream 400: fuel consumption of 32 liters/minute. Let's use that.

Note added: See below.

So Musk burned about 520,000 liters of jet fuel last year. That's 138,000 gallons, or 21% of the volume of an Olympic-sized swimming pool.

Jet fuel emits 9.57 kg CO2/gallon. I don't know about fuel for private jets, but let's use this figure for the estimate. I'll assume jet fuel has the same density as water.

So Musk's flying footprint for 2018 was 1.4 M kg CO2, or 1.3 kt (kilotonnes).

US per capita CO2 emissions are about 17 t CO2/yr, so Musk's total is equivalent to about 77 Americans.

But World per capita CO2 emissions are about 5 t CO2/yr, so Musk's emissions were equivalent to 263 average world citizens.
--
Note added 12:40 pm: I found an important number and can improve on this estimate some: the Gulfstream 650 burns 1,100 kg of jet fuel per hour. This brings Musk's flying carbon emissions for 2018 down to 750 tonnes of CO2, or 0.75 kilotonnes, which is like 44 average Americans or 150 average global citizens.

Saturday, January 26, 2019

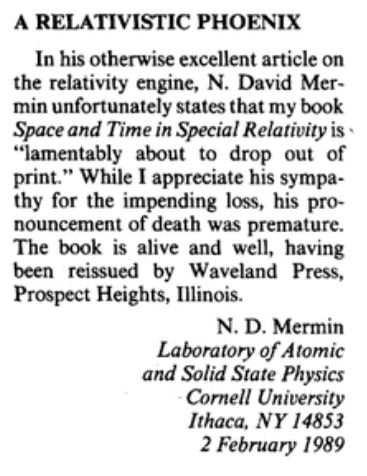
A Funny Letter to the Editor

A letter to the editor of the American Journal of Physics in 1989:


Mermin is both quite a character and quite a good scientist -- I used his textbook on solid state physics, written with Ashcroft, as either an undergraduate or graduate student. (The latter, I think.) He also named the boojum.

Friday, January 25, 2019

Dead Horses in Australia

Wild horses at a dried up watering hole near Alice Springs (BBC). Temperatures reached as high as 49.5°C (121°F). This must be a very terrible way to die.


Thursday, January 24, 2019

Greta

Greta Thunberg, the (now) 16-year old who spoke truth to power at the United Nations Climate Change Conference in December, is at the World Economic Forum in Davos after riding a train from Sweden for 32 hours, shunning a flight as too carbon intensive. Again she sounded like the only adult in the room, and again she told it like it is:
About 1,500 private jets flew to Switzerland for the Davos conference.

Today about 35,000 students in Brussels skipped school to gather as "youth for climate." Thunberg started the first school strike in Sweden just in August of last year, by herself.

At this rate she's going to win the Nobel Peace Prize in a few years. (I'm not kidding; I have half a mind to nominate her myself. But I don't qualify.) This is one very brave kid person.

Doomsday Clock is Still Set to 2:00 'til Midnight

The Bulletin of the Atomic Scientists declined to change the time on their Doomsday Clock -- it's still 11:58:00 pm. "As dangerous as [the Cold War in] 1953.... We are is very close to disaster.... The fact that there's no change [in the clock setting] is bad."

(Or, as someone commented online, "two minutes to Donald.")

Here's their full statement. The time setting is more conservative than I expected.

The Bulletin has labeled this time as "The New Abnormal...unsustainable and unsettling...a disturbing reality in which things are not getting better." Among their reasons:
  • Climate change in an "existential risk."
  • Relations between US and Russia remain "unacceptably strained."
  • Information warfare and fake news are allowed to flourish. 
Quotes above & below are paraphrased and not always in order.

William Perry (old-time nuclear scientist) says climate change is "likely to lead to a climate catastrophe."

Susan Solomon, MIT: (paraphrasing) "Global emissions resumed after apparently plateauing. Worldwide emissions must be cut to zero well before the end of the century. US has the more resources to develop and implement a renewable energy system.... US failure to act is "an act of gross negligence." Paris Agreement is threatened.... World is losing ground in reducing emissions. Greenland's ice melting at unprecedented rate. 2018 to be 4th warmest, despite no El Nino, has contributed to some very serious wild wildfires in California, wildlife deaths in Australia and US.... This coming decade is absolutely critical, and we're running out of time.

Herb Lin had some prescient thoughts on information problems which I failed to capture while listening.

Jerry Brown was the most animated and most adamant. I'll try to find a transcript. He mostly talked about the nuclear situation, and said "It's late and it's getting later, and we've got to wake people in Washington up.... As far as I'm concerned, there's massive sleepwalking all over the place."

I'm hoping I'm alive when the Clock is set to sometime around 8:00 am. That will be a good day.

Monday, January 21, 2019

"Third Thoughts" by Steven Weinberg

“It is generally foolish to bet against the judgements of science, and in this case, when the planet is at stake, it is insane.”

- Steven Weinberg, Third Thoughts; The Universe We Still Don't Know, Google Books: bit.ly/2Cyo5ax
This is from a new book of essays by Weinberg. I haven't read it yet, but it got a great review in Physics Today, who called it "a delightful collection of essays for the general reader." They wrote, "Weinberg often hits the nail right on the head."

PS: Interesting book cover. I wonder what it means. (Weinberg is now 85.)

Sunday, January 20, 2019

South Pole Warming

Eric Steig put this graph on Twitter:
The data are here. Here's a little smoother presentation of the data, in terms of anomalies relative to 1957-1986:


It's just one location -- Amundsen-Scott South Pole Station -- so it can't speak for the whole continent, and it's almost two miles in elevation, but it's still interesting.

Thursday, January 17, 2019

China's Energy Consumption Has Flatlined

I didn't realize that China's energy consumption had flatlined. From the EIA:


Per capita, these data imply that the average American uses 3.1 times more energy than the average Chinese (in 2016). And that US per capita energy use is down 12% since 2000. Increased efficiency? 

Wednesday, January 16, 2019

How to Exploit Your Idiot Customers

Tuesday, January 15, 2019

Guesses For the Update of the Doomsday Clock?

The Doomsday Clock, set every year by the Bulletin of the Atomic Scientists' Science and Security Board, will be reset this January 24th. It's currently set at 11:58:00 pm, up one full minute from 2016. (Here's their full list, which goes back to 1947 when it was 11:53:00 pm.)

Any guesses? There isn't much space left, but I'd be surprised if they can ignore Trump's heedless craziness for even a year, and the contribution of climate change to the hurricanes and wildfires in the US last year.

So I'm guessing they will set it forward by a half-minute.

You can watch this year's announcement on 1/24 on their Web site or Facebook page.

Are Underwater Volcanoes Causing Ocean Warming?

There's important climate news in the last week -- ocean warming has been found to be 40% higher than was given five years ago by the IPCC 5th Assessment Report, bringing it in line with climate model predictions. And Antarctic ice melt is six times greater than it was in the 1970s.

But I feel like blogging about the skeptical conjecture that underwater volcanoes are causing the observed ocean warming. For example, the radio host Lars Larson, whose show I was on last summer, conjectured that recently on Twitter:
Could this be causing ocean warming? Seems unlikely....

1) these volcanoes and vents didn't suddenly flare up during the Industrial era or in the 1970s -- they've been there for, what, billions of years at mid-ocean ridges where tectonic plate spread apart? 

2) But let's do a little back of the envelope calculation to estimate their influence -- for underwater volcanoes, at least. (Plus it's always fun to get a chance to make LaTeX equations again.) Here's what I found:

"About 5 cubic-miles of lava erupt every year along the mid-ocean ridges and submarine fault systems associated with subduction zones...." (Forbes)

The lava is at a certain temperature TL, and the ocean at (an average of) TO. As the lava pours into the ocean, it gives up heat to the ocean, raising the temperature by ΔT. The final temperature of the lava will be TO + ΔT. Then by energy conservation, the heat gained by the ocean is the heat lost by the lava:


where M is mass and C is specific heat. Then

so
where

Here are the numbers I found for lava:


where 1200°C was the maximum value in the given range. For the ocean:


(The initial temperature of the ocean doesn't matter much, since TL is over an order of magnitude larger.) So

α = 4.7 × 10⁹ ≫ 1
and
ΔT = 3 × 10⁻⁷ K/yr

so tiny, as expected. Converting this to a ocean heat gain gives

ΔQ = 1 × 10¹⁸ J/yr = 4 × 10¹⁰ W → 1 × 10⁻⁴ W/m2

over the Earth's surface area. Compare that to the trend found in the first paper mentioned above of about 0.60 W/m2.

So undersea volcanoes only contribute ~0.1% of the ocean's heat gain.

(I think it's hard to imagine just how huge the ocean is. For example, it's 1.5 times more massive than Ceres, the largest body in the asteroid belt, with a diameter of almost 600 miles.)

Anything I missed?

Tuesday, January 08, 2019

Greta

Pacific Island Represent! (@PIrepresent)
We had the honour of meeting .⁦‪@GretaThunberg‬⁩, 15 year-old Swedish climate activist, at the global climate talks in Poland - #COP24. Change is coming ✊ pic.twitter.com/ppZtxX7jlg


Saturday, January 05, 2019

A Professional Scientist Actually Cited This Graph


Who? Roy Spencer. I'm not sure where it comes from, but it doesn't matter -- he needs to retake an undergraduate course in the proper presentation of data, because this graph is scientific malpractice. The proper response can only be this.

Of course, a proper graph -- recall from 5th grade that the point of a graph is to convey as much information as possible -- looks something like this:


and it would have error bars which I'm not going to bother with here. But you get the point. (Note 1/7: I replaced the original graph with one that includes the 1-year (4-quarter) moving average.)

And the 0.04°C on Roy's graph? (I get 0.05°C, but it makes little difference here except that it's just a little tiny additional 25%.) A real scientist would understand (as I'm sure Roy does; he's just more interested in propaganda) that: 

(a) it's really about heat gained, not temperature change, which for these data I find to be 1.4 x 10²³ J. All that heat will not necessarily stay in the ocean, but much will come out to the atmosphere over millennia. The ocean is vast, and has a higher specific heat than air; if this amount of heat were in the atmosphere instead, the temperature change would be ~1000 times larger.

(b) for living things, the problem with ocean warming is that many of them live near the surface, for which the temperature change is much larger. (I wanted to plot the 0-100 m change in the ocean, but NOAA's site is down now because of Trump's moronic government shutdown.) So I have to go with this:


Comparatively, the temperature change of the top 700 m of the ocean is, over the same time period, 0.08°C, and the temperature change of the global sea surface is (HadSST3) 0.26°C. 

Ironically, Roy's post is about Chuck Todd's decision not to allow "climate deniers" on his television show, and how Roy claims there really aren't any climate scientists who deny that the climate isn't warming and man isn't partly responsible. (Except Fred Singer.) So Roy isn't a full-blown climate denier, but then he use the standard dumb denier trick graph that's the most climate denying graph of all. 

One more point. Roy ignores the entire professional literature and cites just one paper by Lewis and Curry, as if it's the final word. And he cheats on that, too, citing the CO2 climate sensitivity they found to be 1.0°C, when that's only the lowest value of their range (added 1/6: and anyway it's the range for the transient climate response -- the warming at the moment CO2 doubles, not ECS), which is 1.0-1.9 C (5%-95% confidence limits). 
Spencer: "...the lastest (sic) analyses (Lewis & Curry, 2018) of what this would mean leads to an eventual warming of only 1 deg. C from a doubling of atmospheric CO2 (we are currently about halfway to that doubling)...."
Now how can Roy think CO2's climate sensitivity is as low as 1.0 C, when 

(a) we've already had 1.0°C of warming.
(b) polluting aerosols are holding warming down by about 0.5°C, and
(c) CO2's share of manmade radiative forcing is, for 1990-2017, 66%.  

These would imply CO2's warming so far is (assuming CO2's radiative forcing fraction is the same since the pre-industrial era) 0.66*1.5°C = 1.0°C, when CO2 hasn't even increased by 50% yet, let alone doubled. 

And Roy is upset that Chuck Todd doesn't want to have the likes of Roy Spencer on his show, and in writing about it shows exactly why Todd doesn't.

Monday, December 31, 2018

Who's Burning the Fossil Fuels?

Here's an admirable case of bookkeeping: "Global Carbon Budget 2018" in the journal Earth System Science Data by Le Quéré and about 80 other co-authors. They crunch a lot of numbers to present the trends in where carbon is coming from and where carbon is going. It's open access, so I'm only going to highlight a few things I found interesting about their Figure 5 on emissions:


Some things I noticed:
  • It's hard to see much hope that global emissions are coming to a peak, though the trend is lower this decade.
  • The US is still the carbon hog of the world. (It's not even close.)
  • Coal is still the predominant source of carbon, and its peak may be reversing.
  • China's per capita emissions seem to be flat throughout much of the 2010s. (Can that be right??)
  • About 10% of China's emissions are for products consumed in other countries.
  • Current per capita emissions for the globe is about 1.2 t/yr -- so the US emits as if it were an average country of 900 million people.
  • US per capita emissions peaked around 1975, and EU28's (the full European Union) around 1980. But US emissions rose again and almost reached a new peak around 2000, whereas the EU's have been on a steady decline since peaking. The decline for both is about 30%. Some fossil fuel advocates snicker than the US has decreased its carbon emissions more than any other country so we deserve a gold star on our forehead, but that's only because we started out with much higher emissions in the first place. Percentage wise it's the same between the US and EU. And it's a dumb argument anyway because we still emit far more per capita than anyone else, as if (they seem to think) Americans have some god-given right to do so.
  • It would be interesting to see the numbers for EU15. (Here's an explainer on the different EU subsets (at the moment!))
  • per capita emissions for the globe have stayed remarkably close to flat for 60 years. It's almost as if the increases from China and India have been offset by the US and EU and everyone else has stayed flat/impoverished.

See anything else?

Monday, December 24, 2018

Merry Christmas

Merry Christmas, whatever you are (or aren't).


Sunday, December 23, 2018

Why I Get so Few Comments

Recently I realized why I don't get many comments on this blog -- I don't blog about open-ended issues.

I certainly appreciate the comments I do get. But here I tend to present graphs, papers, findings, which have little wiggle room. (And, I don't present them as if there's much wiggle room.) But blogs like And Then There's Physics and Stoat do more opinionated posts that leave lots of room for discussion and disagreements or other points of view. I'm not very good at that.

I'll admit, I'm not really a deep thinker and am more interested in the math and the data and the minutiae. That's just who I am. I find numbers more attractive than words or, even in some sense, ideas. Numbers make much more sense to me than words, even as a writer -- I can't diagram a sentence to save my life, barely know what an adverb is, let alone a preposition, and couldn't even do that when I was in 10th grade. I took a college summer class in linguistics after my junior year to fulfill an elective, and none of it made any sense to me at all, and I got a "C" that ruined the 4.0 grade point average I'd had up until then. I wish I was more versatile in big, deep picture thinking, but I've never really been so, even, I think now, when I was doing research in graduate school. Not happy to admit that.

It was probably a good thing that I didn't stay in physics -- though I might possibly perhaps have made it somewhere at a very small college teaching physics to pre-med majors -- but neither does science writing have a big calling for number geeks -- we're too slow, if nothing else, trying to figure out the units. I guess I'm not really fit for much of anything.

Arctic Warming, 1958 vs 2018

Here's a nice comparison of Arctic warming -- north of 80 deg north latitude -- comparing 1958's average temperature to 2018's. (Source.) The warming is obvious, and stark.

PS: The summers aren't warming because when the temperature gets above 0°C, the extra energy goes first into melting ice, and only after in raising the air temperature. (Recall the phase diagram for water.)


Angry Sea

"Two hours from his office, her car crests the cliff road and the church steeple juts into view. The rest of town follows, hunched in rucked hills sloping to the water. Smoke coils from the pub chimney. Fishing nets pile on the shore. In Newville you can watch the sea eat the ground, over and over, unstopping. Millions of abyssal thalassic acres. The sea does not ask permission or wait for instruction. It doesn’t suffer from not knowing what on earth, exactly, it is meant to do. Today its walls are high, white lather torn. 'Angry sea,' people say, but to the biographer the ascribing of human feeling to a body so inhumanly itself is wrong. The water heaves up for reasons they don’t have names for."

― Leni Zumas, Red Clocks