"After California wildfires, insurance companies drop some homeowner policies," Yale Climate Connections, Jan 30, 2020.
https://www.yaleclimateconnections.org/2020/01/after-california-wildfires-insurance-companies-drop-some-homeowner-policies/
Thursday, January 30, 2020
Today's Increase in the Novel Coronavirus
 So cases of the Wuhan coronavirus, 2019-nCoV, are still increasing on a tight exponential path. Yesterday the number of cases increased by 36%. The day before it was 35%. If 100p% is the daily percent increase, the doubling time for that day's increase is (if you do the simple math) Dfor the day = ln(2)/ln(1+p) days, which for p=0.36 is 2.26 days.
There is a little uncertainty in this, because I don't look at the stats the same time every day. But they don't always update their data on a precise timescale, either.
What will stop exponential growth? I don't know. [If you do, leave a comment.] Something must, but what? A lack of viable victims, that is, older people with weak immune systems? So far health authorities are clearly failing. (But of course, it's an impossible problem.) The World Health Organization today declared the virus a global health emergency. Today the US saw its first case of human-to-human transmission, albeit only to the husband of the Chicago victim who recently returned from Wuhan. I would guess that a lot people in the WHO and CDC are extremely worried about this disease's potential, perhaps almost in a panic. But I have no direct proof of that.
Wednesday, January 29, 2020
Wuhan Coronavirus Spreading Exponentially, But....
So far the spreading of the Wuhan coronovirus -- the scientific label is 2019-nCoV, n for "novel," as in new -- has been on an uncannily tight exponential:

Source: John Hopkins University.
The data have a doubling time of just 2.0 days. Of course, it's early still, and this kind of increase can't continue forever. (If it does, the entire population of the planet will be infected by March 7th of this year.)
And the number of deaths is relatively small, at least so far:

which accords with the "2-4%" number I heard this morning on NPR. But the epidemiologist they interviewed this morning said we should be much more worried about the flu:
I have been very sure to get a flu shot every year since.
Another doctor they interviewed said:
I understand that a new disease with no known cure or vaccine is scary. But it's a matter of risk, which the media by-and-large never communicate well.

The data have a doubling time of just 2.0 days. Of course, it's early still, and this kind of increase can't continue forever. (If it does, the entire population of the planet will be infected by March 7th of this year.)
And the number of deaths is relatively small, at least so far:

which accords with the "2-4%" number I heard this morning on NPR. But the epidemiologist they interviewed this morning said we should be much more worried about the flu:
BRANDON BROWN: Last year we had 34,000 deaths from the flu. The year before, we had 61,000 deaths. And this is just the United States. So the one thing that we should really be focusing on right now is the flu. We're in the flu season.I can easily believe that. I had the flu in early 2001, as a healthy adult, and it was the worst illness I've ever had in my life. I was completely bedridden for two weeks, and out-of-sorts for another two weeks after that. (Thanks to my girlfriend-at-the-time Ann, who took very good care of me.) But if I get the same when I'm 70....
I have been very sure to get a flu shot every year since.
Another doctor they interviewed said:
MICHAEL ISON: The mortality for MERS was about 34%. Mortality for SARS was about nine to 10%. And currently, it's somewhere between two and 4% for this novel coronavirus.So as usual the media are missing the message, and unduly creating panic in the meantime.
AUBREY: That's an estimate, and it could change. But the bottom line for those of us who live in the U.S...
ISON: The risk of catching flu is exponentially higher than catching the novel coronavirus.
I understand that a new disease with no known cure or vaccine is scary. But it's a matter of risk, which the media by-and-large never communicate well.
Friday, January 24, 2020
When to Launch a Spaceship to Another Star
I came across a charming little calculation recently, with a counter-intuitive result, that's too good not to pass along -- it's called the "wait calculation." It's the kind of thing you might kick yourself for not thinking of yourself. Anthony Kennedy published it in 2006. (Maybe this is a well known paper, but I just discovered it.) I wanted to do the calculation for myself before I looked at his solution, and almost got it right. Here's what I came up with.
Q: When should we launch a spaceship to another star system?
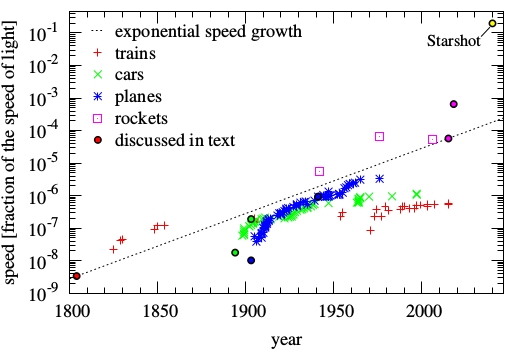
For example, we could launch a generation or hibernation ship today that would take tens of thousands of year just to reach Proxima Centauri with current technology, the nearest star to us at a distance of 4.2 light-years. (That star might even have a orbiting planet in its habitable zone.) Here's a graph from a section of the interesting site Atomic Rockets:

Or should we wait, and, if so, how long? Technology has been getting better for centuries, with an exponential increase in the maximum velocity we can attain. Let's assume this exponential trend continues.
Kennedy used some assumed values for velocity, but I'll try to make it bit more real.
A straight line on a log-linear plot represents exponential growth. The trendline goes from 8e-8*c in 1800 to 8e-3*c in 2010. (Beyond that is speculation.) These speeds are 27 m/s in 1800 to 24,000 m/s in 2010, which are reasonable -- from the speed of a good horse to the speed of the Juno space probe.
With these two points you can do an exponential fit for speed, v = v0*exp(at) and get a=0.0069/yr and v0 = 0.021 m/s. (Strictly speaking v0 would be the speed when t=0, viz. 2010 years ago. Not quite right, but it won't matter much.)
Kennedy assumed the perhaps simpler formula v = v0*2t/h, which makes the velocity doubling time obvious. But I'm a student of physics, so e-exponentials it will be. In my calculation the doubling time is ln(2)/a = 100 yrs.
Let's set up the timeline:

t0 is when v=v0. In the above figure, the Δ's are time intervals. On them, subscript 0 is for the past interval, subscript L is when the last ship leaves the Earth, and subscript D is when the last ship arrives at its destination. W is for wait.
ΔW is how long we should wait, starting today (well, from 2010) to launch the last ship. ΔL is how long the last ship takes to reach the destination.
Let ΔT be the time interval that a ship launched today would take to get to Proxima Centauri. At today's maximum velocity of 24,000 m/s it equals 53,000 yrs.
Here's where I went astray. I thought we wanted to minimize ΔL, but actually, as Kennedy says, we want to minimize ΔW + ΔL.
By taking the ratio of ΔT to ΔL, we get
where a and ΔT are given via the initial data. So
We minimize the right-hand side by differentiating with respect to ΔW and setting the derivative equal to 0. Doing so gives
Anyway the math isn't difficult; thinking up the problem was the hard part, and realizing it could be easily solved. I think it's a fun little problem. And, you get to think about space travel.
Note: slight corrections made from the original version of this post.
Q: When should we launch a spaceship to another star system?
For example, we could launch a generation or hibernation ship today that would take tens of thousands of year just to reach Proxima Centauri with current technology, the nearest star to us at a distance of 4.2 light-years. (That star might even have a orbiting planet in its habitable zone.) Here's a graph from a section of the interesting site Atomic Rockets:

Or should we wait, and, if so, how long? Technology has been getting better for centuries, with an exponential increase in the maximum velocity we can attain. Let's assume this exponential trend continues.
Kennedy used some assumed values for velocity, but I'll try to make it bit more real.
A straight line on a log-linear plot represents exponential growth. The trendline goes from 8e-8*c in 1800 to 8e-3*c in 2010. (Beyond that is speculation.) These speeds are 27 m/s in 1800 to 24,000 m/s in 2010, which are reasonable -- from the speed of a good horse to the speed of the Juno space probe.
With these two points you can do an exponential fit for speed, v = v0*exp(at) and get a=0.0069/yr and v0 = 0.021 m/s. (Strictly speaking v0 would be the speed when t=0, viz. 2010 years ago. Not quite right, but it won't matter much.)
Kennedy assumed the perhaps simpler formula v = v0*2t/h, which makes the velocity doubling time obvious. But I'm a student of physics, so e-exponentials it will be. In my calculation the doubling time is ln(2)/a = 100 yrs.
Let's set up the timeline:

t0 is when v=v0. In the above figure, the Δ's are time intervals. On them, subscript 0 is for the past interval, subscript L is when the last ship leaves the Earth, and subscript D is when the last ship arrives at its destination. W is for wait.
ΔW is how long we should wait, starting today (well, from 2010) to launch the last ship. ΔL is how long the last ship takes to reach the destination.
Let ΔT be the time interval that a ship launched today would take to get to Proxima Centauri. At today's maximum velocity of 24,000 m/s it equals 53,000 yrs.
Here's where I went astray. I thought we wanted to minimize ΔL, but actually, as Kennedy says, we want to minimize ΔW + ΔL.
By taking the ratio of ΔT to ΔL, we get
ΔL = ΔT*exp(-aΔW)
where a and ΔT are given via the initial data. So
ΔW + ΔL = ΔW + ΔT*exp(-aΔW)
We minimize the right-hand side by differentiating with respect to ΔW and setting the derivative equal to 0. Doing so gives
aΔW = ln(aΔT) = 5.91
so ΔW= 852 years
so ΔW= 852 years
Surprisingly (to me at least, initially), we can wait 852 years before launching a spaceship to the nearest star system, assuming our maximum attainable velocity keeps increasing exponentially.
Then we substitute to get
ΔL = 144 years
at which point the velocity of the last ship will be vL = 8.8 M m/s = 0.029 c. That doesn't seem unreasonable. It would arrive in the year 3007.
Surprisingly, waiting even longer to depart after the last launch means an arrival at the destination at a later time than does the last launch. An even faster ship doesn't compensate for a longer wait time. And waiting longer increases the chance that humans will go extinct, either by a natural disaster, a manmade disaster, disease, or warfare. But still, travelers might wait if they want to reach their destination in their own lifetime.
So if we wait we could be at the nearest star in 852+144 = 996 yrs, just under a millenium. The generation ship launched today takes 53,000 yrs, so the ship launched in 852 yrs would pass the generation ship almost immediately after it launches. In fact, it would pass it in (using the above numbers) just 2.3 years after it launched! How dispirating for the generation ship, which would have already been sloging on for 852 years, with a couple of scores of generations having come and gone. This calculation shows there isn't much incentive to launch anytime soon, if a later launch seems socioeconomically feasible.
You might wonder about acceleration and deceleration of the ships, but these are small. Even at the speed of the last launch, it would only take 10 days to start or stop if you desire a rate of ±g. You can add special relativity if you want, but it only affects the time intervals on board the ships, not the amount of time you have to wait on Earth.
However...the sticky point is the assumption that maximum attainable velocity will continue to increase exponentially, forever, or according to whatever function you want to pick. Kennedy has a lot of interesting thoughts on the durability of economic growth (vs available resources) and incentives, and his paper is worth reading just for that. He writes:
Kennedy also writes about the the social implications of waiting vs not waiting, and what travelers will find when they land. I'm not going to go into that, but read his paper.Surprisingly, waiting even longer to depart after the last launch means an arrival at the destination at a later time than does the last launch. An even faster ship doesn't compensate for a longer wait time. And waiting longer increases the chance that humans will go extinct, either by a natural disaster, a manmade disaster, disease, or warfare. But still, travelers might wait if they want to reach their destination in their own lifetime.
So if we wait we could be at the nearest star in 852+144 = 996 yrs, just under a millenium. The generation ship launched today takes 53,000 yrs, so the ship launched in 852 yrs would pass the generation ship almost immediately after it launches. In fact, it would pass it in (using the above numbers) just 2.3 years after it launched! How dispirating for the generation ship, which would have already been sloging on for 852 years, with a couple of scores of generations having come and gone. This calculation shows there isn't much incentive to launch anytime soon, if a later launch seems socioeconomically feasible.
You might wonder about acceleration and deceleration of the ships, but these are small. Even at the speed of the last launch, it would only take 10 days to start or stop if you desire a rate of ±g. You can add special relativity if you want, but it only affects the time intervals on board the ships, not the amount of time you have to wait on Earth.
However...the sticky point is the assumption that maximum attainable velocity will continue to increase exponentially, forever, or according to whatever function you want to pick. Kennedy has a lot of interesting thoughts on the durability of economic growth (vs available resources) and incentives, and his paper is worth reading just for that. He writes:
Using simple equations of growth, it can be shown that there is a time where the negative incentive to travel turns positive and where departures will beat departures made at all other times. Waiting for fear future technology will make a journey redundant is irrational since it can be shown that if growth rates alter then leaving earlier may be a better option. It considers that while growth is resilient and may follow surprising avenues, a future discovery producing a quantum leap in travel technology that justifies waiting is unlikely.
Anyway the math isn't difficult; thinking up the problem was the hard part, and realizing it could be easily solved. I think it's a fun little problem. And, you get to think about space travel.
Note: slight corrections made from the original version of this post.
Wednesday, January 22, 2020
I Would Like to Work Here
The Jungfraujoch research station in Switzerland, which monitors the atmosphere:


Friday, January 17, 2020


About Temperature Changes in the Ocean
Every time changes in ocean heat content make it into the news -- and it reached another high again in 2019, as it does almost every year -- woefully uninformed people like Willis Eschenbach complain that the temperature changes are oh so small, so what can it matter??
It's true that the ocean is vast and has a high mass -- 0.02% of the Earth's mass, in fact. It does not warm or cool easily. But:
a) that does not mean any change in its heat content is small, and
b) it certainly does not mean that the temperature changes by the same amount at all depths.
Exactly because the ocean is so massive, it takes a lot of heat to change its temperature -- in any region. Since 1955, the average temperature of the top 2000 meters of the ocean -- about 1/2 its average depth -- has increased by about 0.10°C. From the heat angle, that means the change in that region's heat content is about 300 ZJ (1 ZJ = 1021 J).
Exercise for the reader: compare this to the rate at which the Earth receives energy from the Sun, either at the top of the atmosphere or at the surface.
So who cares, right? Besides the question of the effect on marine life -- which I'm working on understanding, check back later, but let's point out that at equilibrium there will be little change at all -- what does this mean about the temperature change at various depths? It means it can still change by a lot by depth.
Using NOAA's data on ocean temperature anomalies and ocean heat content, we can calculate the temperature and heat changes in average regions. It's pretty simple; just recall that ΔQ = mc*ΔT (definition of specific heat). The data gives:

Put another way, here is the average temperature change as a function of ocean depth:

There's your thermocline. Calculating temperature change from changes in ocean heat content makes no sense unless you do it as a function of ocean depth.
Thursday, January 16, 2020
edX Course on Global Warming Science
This looks like a good course for anyone who wants to learn the basic science of global warming. It's a step beyond the course Michael Mann taught a few years ago; this one requires knowledge of calculus, mechanics and electromagnetism -- that is to say, college freshman physics. It's taught by Kerry Emanuel (et al) of MIT, and consists of video lectures. It's free to audit. If you haven't wanted to read a climate science textbook but want to go beyond the zeroth-order energy balance equation, this looks like a good opportunity.
Wednesday, January 15, 2020
Pct of Earth with Warmest and Coldest Decade
Here's an interesting result from climatologist Brian Brettschneider -- the percentage of Earth with the warmest and coldest decade since 1900:


BTW, GISS found 2019 was the 2nd warmest year for the globe in their records. Easily the warmest ENSO-neutral year. And it was the warmest year in the southern hemisphere. Northern hemisphere and land-only were the 2nd warmest year. This is the 5th year in a row that the land-only anomaly was > 1°C -- for 2019 it was 1.3°C (2.3°F). For Dec-19 it was a high 1.52°C (2.74°F) -- the 3rd warmest month ever (viz. third highest anomaly).
Friday, January 03, 2020
Greta Thunberg on Living Sustainability
This really hits the nail on the head, and very simply:
Greta Thunberg: "It is impossible to live sustainably today, and that needs to change."I don't think I've ever said this so simply. Or came close.
Record UAH Temperatures
Here we are, in a non El Nino year, and UAH calculates that the lower troposphere was at a record high temperature for December in their records (starting in 1978).
It was also a record high meteorological autumn (Sept-Nov).
The year ranked 3rd highest in their records, making it a record high ENSO-neutral year.
Who ordered that?
PS: One genius at Spencer's blog, Bob Weber, thinks we're in a "mini-ice age."

The 2020s are going to be a contest to see which denier can make the laughable statement possible. Starting out, I nominate this.
US Exporting More Oil Than It Imports
This past week the US had net negative imports of oil -- that is to say, more exports than imports. It's the least net exports since at least 1990:
Of course I don't know what's going on behind the scenes, but I wonder if US oil companies, abetted by the Trump administration, aren't engaged in a last gasp of oil drilling before climate considerations put an end to it. Making us an "energy superpower," in the words of former DOE chief Rick Perry. The gasp might last 10 years or even twenty, but they've gotta see it on the horizon, something coal saw too late.
 |
| Click to Enlarge |
Thursday, January 02, 2020
Australian PM Gets a Firehose of Criticism
The prime minister of Australia, Scott Morrison, visited New South Wales yesterday, which has seen some of the devastating, scary wildfires. In this jaw-dropping clip, the people there gave him a good piece of their mind:
Notice the fireman near the clip's end who refuses to shame Morrison's hand. Notice Morrison feebly trying to address climate change. It was so bad Morrison scambered home.
The fires are expected to get worse.
Notice the fireman near the clip's end who refuses to shame Morrison's hand. Notice Morrison feebly trying to address climate change. It was so bad Morrison scambered home.
The fires are expected to get worse.
Subscribe to:
Posts (Atom)