Since some people seem to have reading comprehension issues, here's a followup statement by my lawyer Roger McConchie with regard to the Tim Ball libel suit: pic.twitter.com/mgcho5j3aK— Michael E. Mann (@MichaelEMann) August 28, 2019

Since some people seem to have reading comprehension issues, here's a followup statement by my lawyer Roger McConchie with regard to the Tim Ball libel suit: pic.twitter.com/mgcho5j3aK— Michael E. Mann (@MichaelEMann) August 28, 2019
Perhaps also of relevance to this point: according to one of my lawyer-friends (disclaimer: not knowledgeable on the Canadian system, but he would be surprised if it were that different there), you cannot use the argument that one's defamatory statements were truthful (or fair based on available knowledge at the time) if one needs information from the aggrieved party in order to find out whether they were indeed truthful.In short: Ball didn't need Mann's files to accuse him of skullduggery. So why does he need them now?
BC Court never made any finding that I failed to produce any data. Anyone claiming otherwise is lying or facilitating a lie.— Michael E. Mann (@MichaelEMann) August 25, 2019
Ball got case dismissed based on:
1. Complaints about his age and poor health
2. Arguing his attacks on me were impotent anyway.
My lawyer's statement: pic.twitter.com/I48leyGxjm
“Michael Mann’s Case Against Me Was Dismissed This Morning By The BC Supreme Court And They Awarded Me [Court] Costs.”Ball was sue by Mann in a Canadian court on March 25, 2011, for Ball’s allegedly libelous statement that Mann “belongs in the state pen, not Penn State.”


To everyone concerned about the future of the Amazon: sensationalizing the current fire season in the Amazon will not help keep it from burning.— Dr Dan Nepstad (@dnepstad1) August 23, 2019
Monthly Amazon fire count data from NASA in recent years: thick red line is 2019 thru present. https://t.co/86C0ZnhbGg pic.twitter.com/LFafdEJTiB
I have studied Amazon forest fire for 25 years. I have seen no evidence that in 2019 Intact Amazon forests are catching fire any more than usual. https://t.co/ggPHvekR8u— Dr Dan Nepstad (@dnepstad1) August 23, 2019
The rate of #Arctic sea ice decline has significantly slowed compared to 2012. It is very unlikely this year will set a new record minimum extent in September. pic.twitter.com/VlGO4GKt6H— Zack Labe (@ZLabe) August 22, 2019


"The more success the quantum theory has, the sillier it looks."from Pais A. (1982). ’subtle is the Lord...’: The Science and the Life of Albert Einstein. Oxford: Clarendon.
- Einstein, 1912

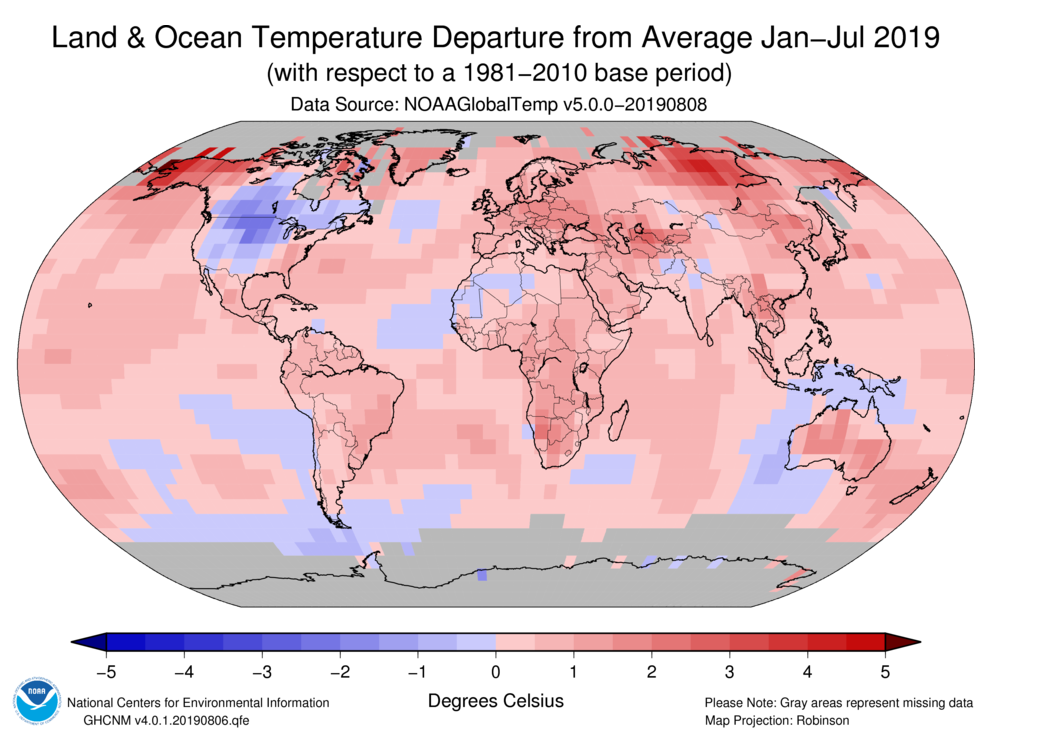


First non-reanalysis July surface temperature estimate, @nstokesvic's TempLS, find that July 2019 was the warmest July on record, driven mostly by warm ocean temperatures: https://t.co/ecgNTJduJr pic.twitter.com/ccD9JSZjG9— Zeke Hausfather (@hausfath) August 7, 2019
 (Skip to the bottom if you want to know the answer right away.)

In the past 48hrs, the USA horrifically lost 34 people to mass shootings.— Neil deGrasse Tyson (@neiltyson) August 4, 2019
On average, across any 48hrs, we also lose…
500 to Medical errors
300 to the Flu
250 to Suicide
200 to Car Accidents
40 to Homicide via Handgun
Often our emotions respond more to spectacle than to data.
You thought this tweet was being whimsical while informative with the goal to make us think...— YS (@NYinLA2121) August 5, 2019
But bro, this is a spectacular-Fail.
Like earth is flat sorta fail.
Wow.
"The Urban Heat Island effect is real. Berkeley’s analysis focused on the question of whether this effect biases the global land average. Our UHI paper analyzing this indicates that the urban heat island effect on our global estimate of land temperatures is indistinguishable from zero."
http://berkeleyearth.org/faq/#question-15
paper:
"Influence of Urban Heating on the Global Temperature Land Average using Rural Sites Identified from MODIS Classifications," Wickham et al., Geoinfor Geostat: An Overview 2013, 1:2
http://dx.doi.org/10.4172/2327-4581.1000104
https://www.scitechnol.com/2327-4581/2327-4581-1-104.pdf
"The results show that the urbanization influence in two of the most widely used hemispheric data sets is, at most, an order of magnitude less than the warming seen on a century timescale."Is there a way to estimate the influence of the UHI? Here's my attempt.
"Assessment of urbanization effects in time series of surface air temperature over land," P. D. Jones et al, Nature, volume 347, pages 169–172 (1990).
https://www.nature.com/articles/347169a0


