Tuesday, August 21, 2012

Bringing the US Kaya Factors Up-to-Date

I obtained the US monthly energy consumption data, and updated my earlier plot of the factors in the Kaya Identity factors for the United States:


I annualized the data to get rid of seasonal squiggles in energy use. "Tech" is what Roger labels technology -- the carbon intensity of the economy:

Tech = EI*CI = C/GDP

(see this post for the acronym definitions). The story remains the same: most of our flattening carbon emissions come from using energy more efficiently, not from reducing carbon emissions per se.

Here's a plot that shows that the average American is actually using less energy than a few decades ago:


[Yes, energy isn't measured in Watts, but since we're talking about a fix period of one year, the two are directly related.] We're flat in energy not because we are trying to use less of it, but because we use it more efficiently.

Monday, August 20, 2012

Why Have U.S. Emissions Dropped?

Emissions of carbon dioxide from the United States have dropped sharply in recent years, and are at what some say is a 20-year low. Why?

Is it because the economy is struggling? Because we're decarbonizing our economy?

Neither. It's largely because of energy efficiency. Here's why.

Carbon emissions can be expressed by the Kaya Identity, which Roger Pielke Jr discusses in his book (which is very good, and I should have read it earlier):

total emissions = POP * (GDP/POP) * EI * CI 

where:
POP = population
GDP/POP = per capita GDP
EI = energy intensity = total energy consumption/GDP
CI = carbon intensity = carbon emissions/total energy consumption

You can gather up all this data: population from FRED, real GDP from FRED, energy consumption from the EIA, and carbon emissions from the EIA. [Actually the EIA shows total carbon emissions increasing by 11% over the last 20 years (1990-2010), but then the claim that they're at a 20-year low is based on the first four months of 2012.]

What you find is that, over the 20 years 1990-2010, population has increased by 24%, per capita GDP by 31%, energy intensity has decreased by 29%, and carbon intensity has decreased by 4%. Energy intensity is what's kept emissions down (relatively), not decarbonization of energy.

And, in fact, most of that decarbonization came in the last 5 years, due to fracking of natural gas -- carbon intensity decreased 4% over the five years 2005-2010. Population increased 5%, per capita GDP decreased 1%, and energy intensity decreased 6%.

I'll look for data past 2010. I have all of it except total energy consumption, which I just haven't looked for.

So the story is, our flat emissions over the last two decades are almost all due to using energy more efficiently, with only about 1/8th of the decrease due to decarbonizing energy. This has changed only in the last half-decade, where decarbonization has been responsible for about 40% of the emissions decline (of 6%).

It seems to me the lessons from this are:
1. Using energy more efficiently is very important, but something we all do anyway because we like to save money.

2. The economic crisis has somewhat exaggerated the emissions decline, but since it (hopefully) won't continue, further emissions reductions will be trickier.

3. We're doing very little to decarbonize the economy per se. But then, why would we, when we can dump carbon waste into the atmosphere for free? You can't beat free.
Update: After I did these calculations I read a little further in Roger's book, where he does the same calculations for the globe and comes to the same conclusion: energy efficiency gains have dominated the last 20 years.

Update: Here's a plot of the evolution of each factor, relative to its 1990 value:


Saturday, August 18, 2012

Less Than 30% of Arctic Ice Melt is Natural

As the Arctic continues to melt -- my little model now predicts a 92% chance of 2007's record minimum being broken -- a recent paper finds that 70-95% of the decline is due to human factors.

The paper is "Sources of multi-decadal variability in Arctic sea ice extent," J J Day et al 2012 Environ. Res. Lett. 7 034011, and here's a little video clip of the lead author.

They found that the Arctic Oscillation (AO) moves ice around but doesn't diminish it, and that the Atlantic Multidecadal Oscillation (AMO), which is currently in its warm phase, about to turn colder, accounts for 5-30% of the observed decrease in September SIE.

This strongly suggest the Arctic sea ice will not be "coming back" when the AMO turns cold sometime (likely) later this decade. But then, it's been melting since before the AMO turned warm, according to data from Cryosphere Today (below). If there's any left, it only might melt a little slower (or may only cancel out the ice-albedo feedback).

A petition the Heartland Institute has out says "sea ice in the Arctic is rebounding." That, of course, is a lie fantasy.

Molina on Feeling Global Warming

“It’s important that people are doing more than just hearing about global warming. People may be feeling it, experiencing the impact on food prices, getting a glimpse of what everyday life may be like in the future, unless we as a society take action.”

-- Mario Molina, keynote address, last next week's American Chemical Society meeting, Philadephia, PA

Friday, August 17, 2012

UAH LT Temperature at Mid-Month

At mid-month, my guess for the UAH lower troposphere anomaly is about +0.34°C. That's warm -- it would be the 3rd-warmest August among 34 years, if you think the data can distinguish among months that are 0.10°C apart. (I'm dubious.) In any case, it's up there. My simplistic method is really only good for the month as a whole (and last month it was spot-on), but in the past the anomaly at mid-month has differed from the anomaly for the entire month by at most ± 0.1°C.

As always, we will hear that global warming is over, that the AMO cool phase is coming, or the PDO flip will soon take hold, or a vastly cooler sun will ruin us for good. In the meantime the ice keeps melting, the seas rising, and the climatalogically relevant trend remains at about 0.15 - 0.20 °C/decade.

By the way, the overall trend for UAH LT is 0.14°C/decade, but if you fit the monthly numbers to something truly entertaining, like a 2nd-degree polynomial, and compute that fit's slope (the first derivative), you get a current trend of dT/dt = 0.23°C/decade.

It's also hot in Oregon -- yesterday it reached 100°F here, at 45.86° north. (Normal high for the day is 81°F.) It finally feels like summer, so any day now there will be some small but unmistakable sign that fall is just around the corner.

Thursday, August 16, 2012

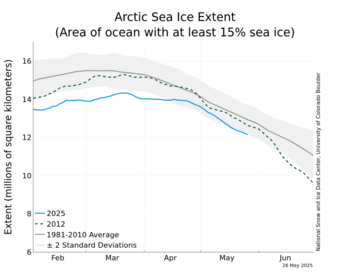
Probability of New Arctic Ice Record: 72% (Est.)

time series
Arctic sea ice extent as of 8/16/12
Will Arctic sea ice extent reach a record low this year?

It looks like it probably will. It's currently at 5.04 million square-kilometers (Mkm2), while 2007's low was 4.25 Mkm2. From this point in the year, the average remaining melt to minimum over the last decade is 0.92 Mkm2, with a standard deviation of 0.22 Mkm2.

So to break the low, this year only needs to be more than -0.60 standard deviations above the mean. If you assume the annual remaining melts are distributed normally, the probability of that happening is 72%.

Moreover, this probability has been growing over the last few days by about 2 percentage points a day. Like all such calculations, it's moderated by the fact that the Arctic is a place that usually defies simple-minded examinations like this one (except that over time, ice will always melt on a planet that is out of energy balance).

(Update, 8/17 a.m.: Overnight numbers have raised this probability to 82%.)

Why does this matter? Jennifer Francis of Rutgers gave a good talk about it:


Sunday, August 12, 2012

Assessing climate model software quality

A couple of computer scientists assessed the software quality of some leading climate models, and find that "the climate models all have very low defect densities compared to well-known, similarly sized open-source projects."

"Assessing climate model software quality: a defect density analysis of three models"
J. Pipitone and S. Easterbrook, Geosci. Model Dev., 5, 1009-1022, 2012
They conclude:
The results of our defect density analysis of three leading climate models show that they each have a very low defect density across several releases. A low defect density suggests that the models are of high software quality, but we have only looked at one of many possible quality metrics. Knowing which metrics are relevant to climate modelling software quality, and understanding precisely how they correspond the climate modellers notions of software quality (as well as our own) is the next challenge to take on in order to achieve a more thorough assessment of climate model software quality.

Driving On a Thread of Gasoline

Here's an interesting little calculation, from the new blog on quantum information at Caltech called Quantum Frontiers:
My car gets about 30 miles per gallon of gasoline. Miles per gallon has the dimensions of inverse length squared, and the reciprocal of 30 miles per gallon is roughly the area of a circle whose diameter is 0.3 mm, or about 1/100 of an inch.

That means that when I drive my car, the fuel I consume has the same volume as a thin thread stretched along the road over the distance I travel, with a thickness just a few times the width of a human hair.

That skinny little thread of gasoline is enough to keep my car going! Thinking about it reinforces one’s appreciation for the internal combustion engine.

Cold Fusion a Result of Beer Goggles?

In his obituary of Martin Fleishmann, co-claimant to the phenomena of cold fusion, Douglas Martin of the New York Times writes:
B. Stanley Pons, a North Carolina native, arrived at Southampton to complete his Ph.D. in chemistry in 1975, and came under Dr. Fleischmann’s wing. The two went on to publish dozens of papers together. Dr. Fleischmann fell into the habit of visiting Dr. Pons once or twice a year after Dr. Pons became chairman of the chemistry department at the University of Utah.

In the early 1980s, the two were hiking in Mill Creek Canyon in Utah when their conversation turned to experimental results from the late 1960s that still puzzled them. They began to conceive a follow-up experiment and fleshed out details at Dr. Pons’s kitchen table while sipping whiskey.
(Emphasis mine.)
Perhaps Pons and Fleishmann's biggest fault was simply not taking a good, clear-headed look the next morning after the beer goggles had worn off.

Saturday, August 11, 2012

Food Price Increase: Equivalent of $0.32 per Gallon of Gas

Regardless of what's causing the current US drought, it's already having an impact on food prices. The UN FAO food price index shot up 6% last month, though it's still below its peak of a year and a half ago (after the Moscow heat wave of July/August 2010). Cereals increased 17%, and sugar 12%. Meat declined slightly.

How much does such a jump cost?

The US spends about $700 billion a year on food. That works out to $190 per person per month, so a 6% increase means an additional $11 per person per month. Not too bad, but that's easily noticeable if, say, you're a family of four on a tight budget. I don't know about you, but when I shop for food I'm amazed at how expensive many things are anymore.

On the other hand, that increase is $42 B/yr, or 0.3% of GDP. If gasoline spending increased that much (the US uses about 8.8 million barrels of gasoline a day), it'd be the equivalent of $0.32 per gallon, which no doubt would get Americans steamed. We're funny like that.

Americans spend 6.9% of their budget on food, which is one of the lowest percentages of any nation. These increases are a much bigger problem for the rest of the world:

Mexico: 24%
Brazil: 25%
Russia: 28%
Indonesia: 43%
China: 33%

Much of Africa is, where it can be measured, in the 35-45% range. The blog Civil Eats has more information, and some of the comments indicate some of the subtleties of the situation. If food prices continue to increase like this in the coming months, poor people in those countries are going to suffer.

So it's good to be rich. But being rich means you emit more CO2, and if part of the drought is CO2-induced you just add to the problem. What a mess. Perhaps the bioengineers can arrange for us to feed via stomata.

HadCRUT4 Updates

I hear that the Hadley Centre expects to start updating their new (version 4) land-and-sea temperature dataset near the end of this month. The current data only goes to December 2010, but the infrastructure for monthly updates is, I'm told, nearly in place.

Here's a video they put out in March that explains the new version:

Friday, August 10, 2012

Hawking Quote

"It is a tribute to how far we have come in theoretical physics that it now takes enormous machines and a great deal of money to perform an experiment [on subatomic particles] whose result we cannot predict."

-- Stephen Hawking

Monday, August 06, 2012

Great Picture from NASA

Here's a great picture from NASA, of MSL's parachute as it came into Mars, taken from the Mars Reconnaissance Orbiter satellite.


The resolution is 33 cm per pixel. MRO was 340 km away from MSL when it took this picture.

Sunday, August 05, 2012

Best NASA Show Ever?

Between the livestream feed, the "Eye on the Solar System" simulation, and the surface images that came almost immediately, that was the best NASA experience I've ever seen -- at least since I vaguely remember watching the Apollo 11 moon landing on a little black-and-white TV late one night long ago -- and maybe better.

It's hard to beat man's first moon landing, but the Web gave this an extra immediacy, with far more information and angles being delivered in real time -- more of a sense you're watching from the inside.

The first images should be here sometime soon.

Update: Here's one, from the rear:

Image taken by Rear Hazcam: Left A

How to Follow Tonight's Mars Landing

As you may know, the Mars Science Laboratory, with the 1 metric ton Curiosity rover, lands on Mars tonight, at 10:31 pm Pacific time. (This is the time when Earth will know the status of the landing; actual landing on the Mars surface is 14 minutes earlier.)

NASA's landing commentary starts at 8:30 pm PDT, here

NASA has a great simulation site, with a live mode, that simulates what MSL is going through on its way into Mars:


The landing sequence is rather wild -- the last step involves lowering the rover to the surface via cables, and even the NASA engineers think it looks "crazy." (At a press conference on Thursday, NASA's Adam Steltzner said "I promise you it is the least crazy of the ways you could use to land Curiousity on Mars.") This video summarizes the "seven minutes of terror":


About 50% of all missions to Mars have failed, and about 70% of surface landings have failed. The rover is the size of a compact car -- if this works, it seems to me it will be one of the most amazing technical feats in space history. I imagine the MSL engineers are pretty nervous right now, but also having the time of their lives (literally).

Added: However, the US is 6 for 7 on Mars landings.

Here We Go Again

Just two weeks later and here we are again:
Seven people have died in the shooting incident at the Sikh Temple in Oak Creek, Wis., Greenfield Police Chief Bradley Wentlandt tells reporters. One of those was the shooter, he said.
If these were "terrorist" incidents, the country would be freaking out and authorities would be scrambling in a thousand directions at once. But they're not considered terrorism, so everyone will just shrug their shoulders and mouth the usual platitudes -- if they bother to do even that much.

PS: And it's not just the Colorado and Wisconsin incidents. A few days before the Aurora shooting 17 people were shot in an Arkansas bar. And as Gary Younge wrote in The Nation, "On the night after the shooting in Aurora, twenty-two people were shot, three fatally, in Chicago. But when the chaos of the hood intrudes on the security of suburbia, a moment of collective cognitive dissonance occurs." He also included this:
"America leads the world in shocks," noted the late singer Gil Scott-Heron in "We Beg Your Pardon." "Unfortunately, America does not lead the world in deciphering the cause of shock."

Predicting Breakthroughs: 1937 NAS Study

From Our Final Hour by Martin Rees:
"In 1937 the US National Academy of Sciences organised a study aimed at predicting breakthroughs; its report makes salutary reading for technological forecasters today. It came up with some wise assessments about agriculture, about synthetic gasoline, and synthetic rubber. But what is more remarkable is the things it missed. No nuclear energy, no antibiotics (though this was eight years after Alexander Fleming had discovered penicillin), no jet aircraft, no rocketry nor any use of space, no computers; certainly no transistors. The committee overlooked the technologies that actually dominated the second half of the twentieth century. Still less could they predict the social and political transformations that occurred during that time."

Saturday, August 04, 2012

What if Natural Gas Produced All Our Energy?

I was thinking about something Roger Pielke Jr wrote on his blog:
The fact of the matter is that the world will accelerate the decarbonization of its economy when clean energy is cheaper than dirty energy. The remarkable transition to natural gas shows that.
That's probably almost certainly true, at least if you ignore negative external costs (which are very difficult to get people to pay for anyway -- or, at least, to pay for up front). Anyway I was thinking, what if we got all our energy from natural gas? That is, how much carbon would we save if all the energy we now obtain from oil and coal were instead obtained from natural gas?

The carbon savings aren't that large: about 700 Mt CO2/yr less than the 5,471 Mt we emitted last year, or 13%.

The numbers: 
The CO2 numbers for energy consumption are here; in 2011 the US emitted

coal: 1,867 Mt CO2
natural gas: 1,294 Mt CO2
oil: 2,299 Mt CO2

for a total of 5,471 Mt CO2.

These can be converted into energies via conversion factors; I'll use

coal: 94 g CO2e/MJ
natural gas: 68 g CO2e/MJ
oil: 73 g CO2e/MJ

(MJ = Megajoule), which works out to 17.5 metric tons per person per year. (Incidentally, that's down 21% from 1973's 22.3 tonnes, and down significantly even from 2004's 20.4 t.) Admittedly this ignores subtleties about different types of coal, the energy required to produce energy, that we can't currently fly planes on natural gas, etc. This is good enough for blog work -- or, if you will, a gebloggen experiment.

Converting, I estimate the US used 70 trillion MJ of energy in 2011, or a power consumption of 2.2 terawatts -- 7,100 Watts per person!

Converting back, if all this energy were produced by natural gas, we'd have emitted 4,800 Mt CO2, which is still a per capita emission of 15.3 t CO2, or 13% less than what we emit today.

So we would save some significant carbon emissions. But it would not nearly be enough to stabilize climate, which requires emissions cutbacks of roughly 80% by the US.

Transitioning to natural gas is a good thing (as long as your drinking water isn't getting fracked up). But really solving the carbon problem requires a game changing technology.

Wednesday, August 01, 2012

Double Standards Better Than No Standards at All?

If some people didn't have double standards, they'd have no standards at all. Andrew Orlowski in The Register:
"Analysis Richard Muller's Berkeley Earth Surface Temperature (BEST) project, which began with goodwill from all corners of the climate debate, has made a series of bold announcements (without benefit of peer review) to the effect that global warming is definitely serious and definitely caused by humans."
(emphasis mine). Just a few paragraphs later:
"The second comment is worth taking the time to read, as new research using a much more comprehensive classification system puts the lack of rigour in dealing with the UHI effect in the spotlight. BEST appears to replicate the lack of rigour, and worse, appears not to care overmuch."
That "new research," of course, is also not peer reviewed, and it has quickly been found to have serious flaws, as the co-authors now admit. (Somehow, though, it was good enough to be presented as Senate testimony.)

Why do people make it so easy?

Liveblogging the Senate Hearing

Webcast here.

9:02 am
Sessions: "I've voted for mileage improvements and efficiences, and ethanol expansions.... If CO2 is causing an increase in temperatures, all these steps will help alleviate it. It's just a question of how much we can afford to spend."

9:00 am
Boxer: "I'm not panicked about global warming...."

8:58 am:
Christopher Field ends with perhaps the most sensible statement of all: "There are consequences to using the atmosphere as a dump" [and (paraphrasing) they're just trying to provide information to policymakers].

8:54 am
Senator Boozman (R-Arkansas) cites Y2K as an example of an imaginary problem. Hey, boatloads of money was spent to head that off -- billions!

8:49 am
Lautenberg to Christy: "You're entitled to your own bias, if you will."

8:47 am
McCarthy, on Climategate: "The scientists were [only] guilty of bad manners."
Christy: "I disagree with [McCarthy's] view of Cliamtegate."

8:34 am
Lautenberg steps back and talks about the attempts to discredit science.

8:44 am
Senator Sessions: "Can CO2 increase temperature? I would say there's some logic to that question."

8:42 am
Senator Sessions: "A forest fire is no proof of global warming -- give me a break!"

Aside: Skeptical Science has a critique of Watts et al (2012), including the Time of Observation (TOB) issue many people are talking about. (That's the kind of thing that proves this paper wasn't near ready for peer review.) Gregor Vertacnik: "As a climatologist experienced in monitoring, data quality control and also homogenisation I must say this is one of the worst papers about climate change I've ever read."

8:39 am
Inhofe quotes Lovelock. I think some Senate staffers are spending too much time reading the Internet, and not enough time reading reports.

8:37 am
John Christy: "The global warming issue is highly overblown." [Fields and McCarthy say there is no hoax. But then, they would say that if there was one, wouldn't they? :-) ]

8:33 am
John Christy: "The world has warmed in the last 20 (120?) years? I believe the question is...can you do anything about it?"

8:31 am
Senator Sanders and Inhofe are spending a lot of time telling us how much they like each other despite their disagreement on GW. I wonder.

8:29 am
Boxer to Inhofe: "Just relax, Senator."

8:29 am
John Christy: "Our ignorance of the climate system is enormous. We cannot predict much at all."

8:27 am
Inhofe calls 1940-75 an "ice age."

8:24 am
Inhofe quotes Mann as an attempt to discredit Muller. Tit-for-tat when it's useful.

Christy's written testimony cites Watts et al (2012). Wow. In response to a question from Boxer he admits it hasn't been submitted to a scientific journal yet. Blog posts are now evidence for Senate hearings?? That strikes me as a very poor choice on Christy's part.

8:14 am
McCarthy:
(paraphrasing) There is no scientific evidence that the observed warming can be expalined by other than greenhouse warming.

8:11 am
James McCarthy emphasis ocean warming. "The ocean has warmed steadily over the last 10 years." (Avoids all the many problems in homogenizing the surface dataset too, though of course any data-gathering requires a lot of data analysis of subtle issues.)

From John Christy's testimony: "Today, affordable carbon-based energy is a key component for lifting people out of crippling poverty.  Rising CO2 emissions are, therefore, one indication of poverty-reduction which gives hope for those now living in a marginal existence without basic needs brought by electrification, transportation and  industry." Yes, but that doesn't make it an appropriate energy source for people who aren't in poverty. Why can't they pay for the damage their energy use does to the property of others and damage to the Common?

7:54 am: Judith Curry has a copy of John Christy's testimony, and a summary.

Lots of mentions of Muller's article in the NYT. (Perhaps it was aimed for this hearing instead of an IPCC deadline?)

7:44 am
Lautenberg: Taxpayers will shell out $30-40 B in crop insurance this year.

7:41 am
Lautenberg: "Our friends on the other side happen to be likable people, but they're wrong."
Inhofe interrupts: "I agree with half your statement." (laughter)
Lautenberg: "That you're likable?" (laughter)

7:40 am PDT
Senator Lautenberg calls today a "bonfire of reality." That's a phrase that might stick somewhere.

7:35 am PDT
Senator Sessions:
"We may well have some warming and it may be human caused." (After saying there has been no warming in the last 10 years.)