Thursday, June 27, 2013

Judith Curry Does a Roy Spencer

Judith Curry has chosen the low road, recently traveled by Roy Spencer. She writes:
Scientists can shift their attention from religious adherence to consensus science and get on with the real work of trying to understand the dynamics of climate variability and change.
Again, this is another very unprofessional statement, written only to instigate conflict with other scientists with whom she disagrees but hasn't been able to best in the journals -- as if she's the only one doing science, and the rest are just practicing religion. That's just low. It's Anthony Watts-level baiting, and to me it's simply incompatible with the decorum and respect scientists have always given to one another.

It is sad to see. And it is telling -- the lack of scientific protest against Obama's speech this week says that the scientific arguments have essentially won the day. The oceans are warming, ice continues to melt, sea levels continue to rise -- denying such macroscopic indicators is simply no longer believable.

By all means, argue about the economics and the cheapest way to address the problem. But cheap shots from scientific quarters are unseemly and completely unnecessary.

Inhofe Campaign Slogan

Via Politico:


Wednesday, June 26, 2013

Peak Water?

Here's a very interesting graph of water usage in the US, versus Gross National Product, from the Pacific Institute:
Via Peter Gleick on Twitter.

"Fanatical Minorities...Getting Smaller All the Time"

Paul Krugman on today's Supreme Court decisions:
This is really amazing when you bear in mind that this very issue was used to mobilize the right-wing base in 2004. The change in attitudes in such a short period is awesome.

I haven’t seen a good analysis of this transformation. But whatever caused it, it’s a testament to American tolerance and open-mindedness. We have our fanatical minorities — but they are minorities, and they’re getting smaller all the time.

Tuesday, June 25, 2013

Stock Market Not Impressed with Obama's Speech

The market, at least, doesn't seem very impressed with Obama's speech on climate change. Here's the stock price of Arch Coal, the second largest US coal supplier:

Chart forArch Coal Inc. (ACI)

(Though it's still down about 10% from a week ago.) And here is the price of ANR, the largest US coal producer:

Chart forAlpha Natural Resources, Inc. (ANR)

"We don't have time for a meeting of the Flat Earth Society."

Best line in Obama's speech:

"We don't have time for a meeting of the Flat Earth Society."

Where to Watch Today's Address on Climate Change

President Obama's address on climate change is at 1:55 pm EDT. 
You can watch it live here:
http://www.whitehouse.gov/live

Andrew Revkin has a good preview.


Monday, June 24, 2013

Study: Fracking is Affecting Some Water Quality

Update: Here's an AP story.
--
Due to an embargo break (which tells you someone thinks this is a hot story), PNAS just lifted the embargo on the paper “Increased stray gas abundance in a subset of drinking water wells near Marcellus shale gas extraction,” by Robert B. Jackson of Duke University, et al.

They looked at water wells within 1 kilometer of trhe Marcellus shale gas wells in northeastern Pennsylvania and southeastern New York, and found that
"...82% of the wells analyzed contained methane; on average, methane concentrations were 6-times higher for homes located less than 1 km from drilling sites than for homes farther away. Concentrations of ethane and propane were also higher for homes located within 1 km of drilling sites. Furthermore, the authors found that distance to gas wells was the most significant factor to influence drinking water methane and ethane concentrations. In some cases, the chemical signature of the gases in drinking water was characteristic of a Marcellus-like source, according to the authors."
From the article:

It will be interesting to see how this plays out....

Saturday, June 22, 2013

About the Pause

Re: The Pause

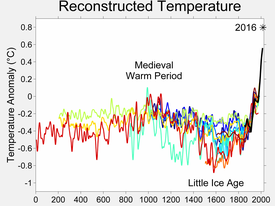
Raise your hands -- who here would judge the Medieval Warm Period based solely on what happened from 1002 A.D. to 1013 A.D.?

From 998 A.D. to 1013 A.D.?

Anyone?

Thursday, June 20, 2013

Speaking of Surprises....

Speaking of surprises: Who predicted the ozone hole?

No one, that's who.

What other surprises are out there, especially in an enhanced-greenhouse world?

We Live on Land, Not in the Oceans

Judith Curry writes:
Exactly how does focusing on the mean surface temperature miss the point? Global warming is pretty much defined in context of the mean surface temperature. People live on the surface, not in the ocean below 700 m.
OK. But people don't live on the surface of the ocean either, which is warming much slower than is the surface of the land.

The 30-yr trend of CRUTEM4, which only includes land measurements, is 0.28°C/decade -- 1.5°F of warming in just three decades.

The 15-yr trend is 0.11°C/decade.

By contrast, the 30-yr trend for HadCRUT4, which measures the entire surface, land + ocean, is 0.17°C/decade. The 15-year trend is 0.05°C/decade.

Clearly land is warming much faster than the ocean. Where does this fit in the calculations?

It seems to me the real question is: does the Earth system have an energy imbalance? If so -- if more energy is coming in than leaving at the top of the atmosphere, then there will be warming. Sometimes it will be mostly in the oceans, sometimes larger on land, almost always melting ice and raising sea level.

That's the real question. And if it's a mystery why the ocean has lately been taking up more heat than it was before, how is that comforting? What other unexpected and unforeseen changes lie in our future? Will the next one be to our benefit, or our detriment?

WUWT: Ocean Misunderstanding and Confusion

Willis Eschenbach has a post at WUWT that is a masterpiece of misunderstanding and befuddlement.

In their never-ending quest to show that all findings of standard climate science are wrong, Willis tackles ocean warming, in "Forcing the Ocean to Confess."

Global Ocean Heat Content 1955-present 0-2000 m
Now, even my cats could look at the plot to the right and see the top half of the ocean is strongly and steadily gaining heat:

But not Willis. His work leads him to the following conclusion:
"...neither the average forcing, nor the trend in that forcing, are significantly different from zero. It’s somewhat of a surprise.

"The third is that in addition to the mean not being significantly different from zero, only a few of the individual years have a forcing  that is distinguishable from zero.

"Those were a surprise because with all of the hollering about Trenberth’s missing heat and the Levitus ocean data, I’d expected to find that we could tell something from the Levitus’s numbers."
What was Willis able to whip up in a little spreadsheet that disproves what all the professionals have determined? Some bad physics, that's what.

To see if ocean heat content (OHC) is increasing, most people would just calculate its trend, which is an approximate for its first derivative d(OHC)/dt, where t is time.

Instead, Willis first takes the annual difference in OHC, calls that the forcing (which it isn't really, but that's another story), and calculates the trend of that.  He finds it slightly positive, though not significant at the 95% confidence level:

annual forcing into out of the ocean

But that's equivalent to calculating the second derivative of OHC, i.e. the acceleration of the ocean's heat gain.

Willis gets himself all confused including autocorrelation in the statistics of the trend, which is a topic for another day. What's more relevant is that he doesn't understand what he's calculating, and why it says little about ocean heat content.

The trend of a function and the trend of its first derivative can have very different uncertainties, because the latter is a difference of differences, which often can fluctuate more than a first difference.

Here is an clean example that makes Willis's error explicit, without the malarky of all the statistics. Suppose the ocean heat content for year Y is

OHC(Y) = kY

where k is a positive constant. Obviously this ocean is gaining heat year after year, with a slope of k units per year.

Then what Willis is calling the "forcing" (again, it isn't really), and what he's plotting above using the real OHC data, is

F(Y) = {OHC(Y) - OHC(Y-1)}/A

where A is the area of the ocean. In this example F(Y) = k/A for all years, i.e the "forcing" is a constant. Hence it has a trend of zero (0).

But that doesn't mean the ocean isn't warming, viz. gaining heat. Clearly it is.

A constant forcing means warming. Only a zero forcing means no warming.

Willis sort of tries to cover his huge error by saying the "forcing" he's calculating isn't statistically different from zero. He finds the mean of the annual values to be 0.2 ± 0.3 W/m2.

But again, that number has a different interpretation that the one Willis tries to give it, because it's a mean and not a trend. The average forcing is positive, i.e. most years have a "positive" flow of heat into the ocean. Some years don't, and you could use the standard deviation above to find out what percentage of years don't.

But the average forcing is positive. The ocean is, on average, gaining heat. But remember, this is the second derivative of OHC(t), not the first. The first is clearly positive, and has strong statistics.

I find, using the pentadal temperature anomalies (the OHC results are here) a temperature trend of 1.25 ± millikelvin/yr, which translates into a OHC trend of

0.34 ± 0.02 W/m2
(1-sigma, no autocorrelation, total area of the ocean)

Now, autocorrelation will increase the uncertainty by a small factor (usually it's around 3), but hardly by a factor of 17! (Willis messes that up, too, but it's tangential to the main point.)

The ocean is gaining heat, i.e. warming. Willis's methodology is wrong, confused, and...well, too-often typical.

Wednesday, June 19, 2013

Killing the "Cooling Since 2002" Meme

The driver of the climate clown car is trying to cook up a new meme, based on this unfortunate Judith Curry post -- global cooling since 2002.

Of course, it isn't true when you look at the entire Earth, but it isn't even true if you only look at the surface -- neither cooling nor warming is statistially signficant in such a short time period.

Here's the trend since 2002 for the GISS global surface temperature:


The uncertainty is huge. There is simply too much inertia and too much noise in the climate system to say anything climatologically meaningful over such a short time period, which in this case is heavily influenced by two La Ninas near the end of its interval.

I don't, of course, expect anything like a commitment to the truth from Morano, but certain other people ought to know better.

"The tragic consequences of 'the American way of life'"

"So we have reached the point in history where we must face up to the tragic consequences of 'the American way of life,' a way of life also lived in other affluent countries, albeit typically with less intensity and ideological conviction. The same qualities that made the United States a great nation -- relentless optimism, commitment to know-how, determination to expand -- have become the enemies of its preservation and, collaterally, the preservation of the rest of humanity. A nation that has expansion running in its blood can barely conceive of contraction, and so the question we well soon be forced to ask is how much of the rest of the world will be sacrificed to prolong the dream of affluence?"

-- Clive Hamilton, Earthmasters: The Dawn of the Age of Climate Engineering
"...if the meek are ever going to inherit the Earth then they had better be quick."

-- Clive Hamilton, Earthmasters: The Dawn of the Age of Climate Engineering

Tuesday, June 18, 2013

Army Corps Opts-Out of Its Mission Statement

The Army Corps of Enginners opted to ignore its Mission Statement today, telling Congress it won't comprehensively review proposed Pacific Northwestern coal export terminals.
The U.S. Army Corps of Engineers will not conduct an all-encompassing review of the three coal export projects proposed in the Northwest, rejecting requests from  Oregon and Washington's governors and project opponents.

Jennifer Moyer, acting chief of the Corps' regulatory program, told a House subcommittee today that the agency would review the three proposed export terminals separately, and would not directly address some of the opposition's top concerns. All three projects seek to export Montana and Wyoming coal to Asia through the Northwest.

"Many of the activities of concern to the public, such as rail traffic, coal mining, shipping coal outside of U.S. territory, and the ultimate burning of coal overseas, are outside the Corps' control and responsibility," Moyer said in prepared testimony.
ACE's Mission Statement reads:
Mission Statement: Provide vital public engineering services in peace and war to strengthen our Nation's security, energize the economy, and reduce risks from disasters.
And its Vision Statement is:
Vision Statement: A GREAT engineering force of highly disciplined people working with our partners through disciplined thought and action to deliver innovative and sustainable solutions to the Nation's engineering challenges.
There's simply no way you can argue that the proposed exports, which would total 110 million tons annually, might not possibly increase "risks from disasters" (and hence require a review) or not constitute a "sustainable solution." That amount of coal would, when burned, emit about 250 million tonnes of CO2 a year (about 5% of US emissions), costing, according the EPA's social cost of carbon, over $9 billon annually.

+1 for politics, -1 for the environment. Science is left to softly weep over in the corner, its hankie thoroughly soaked by now.

Monday, June 17, 2013

Steak For Me, But Not For Thee

From an article about Google's Balloon Internet project that could provide Internet access everywhere on Earth:
Temple University communications professor Patrick Murphy warned of mixed consequences, pointing to China and Brazil as places where Internet service promoted democratic principles but also contributed to a surge in consumerism that has resulted in environmental and health problems.

"The nutritional and medical information, farming techniques, democratic principles those are the wonderful parts of it," he said. "But you also have everyone wanting to drive a car, eat a steak, drink a Coke."

Sunday, June 16, 2013

BEST Paper: AMO is Best Correlation with Global Temperatures

And to think I just gave Judith Curry grief for ignoring ocean warming.

OK, it's not exactly the same thing, but the BEST team has a paper out in JGR: Atmospheres:
Muller, R. A., J. Curry, D. Groom, R. Jacobsen, S. Perlmutter, R. Rohde, A. Rosenfeld, C. Wickham, and J. Wurtele (2013), Decadal variations in the global atmospheric land temperatures, J. Geophys. Res. Atmos., 118, doi:10.1002/jgrd.50458.
Its abstract reads:


Their most relevant figure is


showing that the AMO has a better correlation with surface temperatures than does the PDO. (But not by a huge amount. But I need to read the paper in full to better understand.)

The AMO is currently in its warm phase, since the mid-1990s, and the PDO its cool phase. So, I think, this finding would imply a new cooling influence on surface temperatures (countering the enhanced greenhouse effect) until about the mid-2020s....

Is a Geoengineering Experiment Now Taking Place?

There is an intriguing statement by UK climate scientist Piers Forster in an RTCC article; near its end he says,
"There is one experiment we’re currently undertaking – we’re trying to look at rescuing Arctic Ice by stimulating aeroplanes flying from Spitzbergen in Norway – and dump out a lot of Sulphur Dioxide, and we’re trying to look at that as a very short term protection against the loss of Arctic Ice."
It's unclear what "simulation" means -- I've written to ask him for more details. If it's actually planes dumping sulphur dioxide into the stratosphere, even on a small scale, that would be a huge deal, since no one has yet to do more than study such proposals, and there are all kinds of reasons why such "solar radiation management" (SRM) may be a bad idea. (I wrote about some of the ethical questions here.) Even as an experiment, it would be a huge step in a direction no one has yet dared to go.

A Record for the Pause?

In what may be a record for the claimed length of The Pause in global surface temperatures, a columnist in South Africa named David Gleason writes,
Between 1995 and last year carbon dioxide levels in the atmosphere rose 10%, but global temperatures not at all.
This is complete nonsense. HadCRUT4 shows the globe warming 0.17°C (0.31°F) since January 1995, a number that is very statistically significant(*).

How that equals zero, I have no idea.

By the way, the David Rose Hole still exists, barely. There is still a 9-month period from 5/1997 to 1/1998 where there is warming-til-today, but whose statistical significance falls below 95% -- all the way to 89%. (*Again, no autocorrelation.)

(*) This conclusion doesn't includes autocorrelation. Slope uncertainties that take autocorrelation into account are nearly impossible to calculate using Excel, if you want to calculate them for a range of dates, because you need to create an array of the residuals for each interval. And I just haven't gotten around to writing a Python or R script to do it. Using the SkS trend calculator, I find that the HadCRUT4 trend since Jan-1995 is 0.095 ± 0.109 °C/decade (2σ), which is not quite statistically signficant warming at the 95% confidence level, though it is at the 92% level -- the large uncertainty simply showing that it's usually difficult to make statistically signficant conclusions about climatologically short time intervals (as I wrote about in the Sidebar here).

Saturday, June 15, 2013

Stunned by a Judith Curry Post

I'm sorry, but I simply cannot understand this kind of thing from a scientist.

Judith Curry writes:
This period since 2002 is scientifically interesting, since it coincides with the ‘climate shift’ circa 2001/2002 posited by Tsonis and others. This shift and the subsequent slight cooling trend provides a rationale for inferring a slight cooling trend over the next decade or so, rather than a flat trend from the 15 yr ‘pause’.
I simply cannot fathom why any scientist would make such claims about short time periods - they are not representative of climate, but of natural variability.

I try, I really try when I write my articles, to include alternative voices. But anymore the (so-called) skeptics are getting increasingly ridiculous: this quote by Curry, Roger Pielke Jr's claim that Marcott et al bordered on misconduct, or John Christy's flogging an Anthony Watts blog post in front of Congress a mere couple of days after it appeared on a blog and before it was submitted for peer-reviewed. (And where, can I ask, has this finding yet appeared in the peer-reviewed literature? Nowhere, that's where.)

I have the utmost respect for the values of science and want to believe that all scientists are coming from an intellectually honest place.

But when I read things like this, I am simply stunned.