Wednesday, October 28, 2015

Does Senator Smith Know NOAA's Adjustments *Lower* the Trend?

I wonder if Senator Lamar Smith, who wants all the data, emails, and the birthdays of the children of the NOAA scientists who contributed to Karl et al, Science (2015), knows that the adustments made to the raw data lower the long-term warming trend?


That would be fun to watch in Congressional testimony..... And that the raw data is easily available, as Karl et al write in their supplementary material:
"The data sets are the publically available ERSST v4 data set of sea surface temperature anomalies (13) ftp://ftp.ncdc.noaa.gov/pub/data/cmb/ersst/v4, and the ISTI Databank v1.0.0 of land surface air temperature (14) http://www.surfacetemperatures.org/databank." 

Question For Lamar


If Lamar Smith wants NOAA's emails, can we get Lamar Smith's emails?


And his staff's too.

Saturday, October 24, 2015

The Two Faces of Mark Lynas

Mark Lynas.jpgThe science writer Mark Lynas has an op-ed piece in the New York Times, "With G.M.O. Policies, Europe Turns Against Science."

In it he criticizes the Eurpoean Union for their rejection of crops that are genetically modified. They're "anti-science," he says.
CALL it the “Coalition of the Ignorant.” By the first week of October, 17 European countries — including Austria, Denmark, France, Germany, Greece, Hungary, Italy, the Netherlands and Poland — had used new European Union rules to announce bans on the cultivation of genetically modified crops.

These prohibitions expose the worrying reality of how far Europe has gone in setting itself against modern science.
Lynas tugs at our heartstrings, telling you about the terrible things he's seen:
I have spent time with malnourished children in Tanzania whose families were going hungry because cassava crops were wiped out by brown-streak disease. That was particularly painful because in neighboring Uganda I had recently visited trial plots of genetically modified cassava that demonstrated complete resistance to the virus. The faces of the hungry children come to mind every time I hear European politicians boast about their country’s G.M.O. ban and demand that the rest of the world follow suit — as Scotland’s minister did in August.
Those heartless Europeans, going against science and starving children. How could they?

And indeed they are anti-science, in this case. But what Lynas doesn't tell you is the outsized role he had in creating Europe's anti-scientific attitude towards GMOs.
He [Lynas] admitted "... in 2008, I was still penning screeds in the Guardian attacking the science of GM – even though I had done no academic research on the topic, and had a pretty limited personal understanding. I don’t think I’d ever read a peer-reviewed paper on ]asingly inconsistent with my pro-science environmentalism with regard to climate change." [Wikipedia]
Lynas doesn't write a thing about what role his wrting, activism and crimes played in creating the very atmosphere he now wants to excoriate as being anti-scientific.

Lynas is whitewashing his own history. How many children starved because of him?

By the way, GMOs have nothing at all to do with climate change. They're separate subjects with little overlap, and the science on both of them is clear. The science on GMOs has been known for well over a decade -- they aren't harmful, and there's no reason to expect they could be harmful.

But instead of reading and understanding the science, Mark Lynas wanted to be a vandal and a criminal. He wanted to be an activist -- an anti-science activist. I wonder if, in his conversion on GMOs, he offered to pay for the damage he created in the farming and research fields of Europe?

Who knows what Lynas will want to be next month? Whatever it is, it probably won't be determined by science. Maybe by just whatever position gets him in print.


PS: The New York Times has been rejecting a comment that points out Lynas's hypocrisy. Why would they be protecting Lynas?

Friday, October 23, 2015

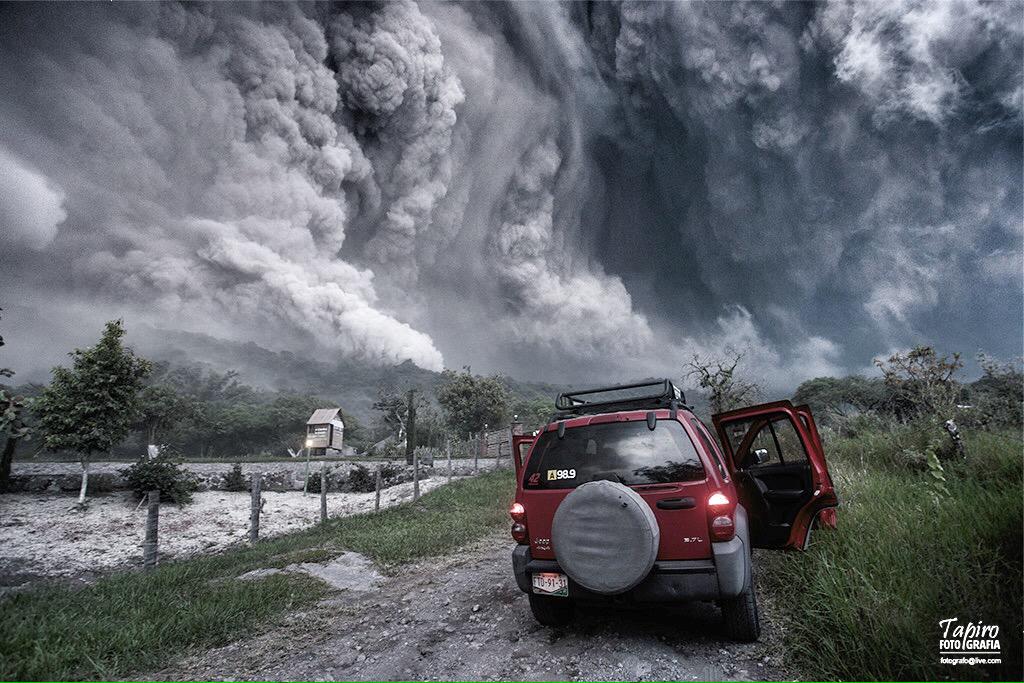
Hellish Photo of Colima Volcano

This is from the Colima volcanic eruption in July of the year, not Hurricane Patricia (as I first thought.) Via Twitter:

Embedded image permalink

Wednesday, October 21, 2015

Global Warming, Productivity Loss and Economic Costs

There is an important paper published in Nature today:

"Global non-linear effect of temperature on economic production,
 Marshall Burke, Solomon M. Hsiang & Edward Miguel,
Nature (10/21/2015) doi:10.1038/nature15725

Since it puts an economic model atop a climate model, I'm automatically somewhat dubious. The climate models have enough uncertainities. Economic models have so much uncertainty that modelers there don't even try to establish error bars or confidence intervals. Or at least it seems that way to me, with my quite limited knowledge of economics. 

For example, suppose you wanted to project U.S. GDP to the year 2100. Here are the historical data, from FRED:


Clearly the Great Recession of 2009-2010 took a big bite out of GDP -- a bite that, so far, looks to be permanent. 

If you were to project GDP in 2100 based on the historical values from before the Great Recession, 1950-2008, you'd clearly get a number that is much bigger than if you project from using the full 1950-2014 data. 

I should put up a nice little graph here showing this. Bad blogger. Instead I'll just use this:

U.S. Real GDP growth and trend

The point is, economic projections seem to have at least as difficult time anticipating nonlinear events, like the Great Recession, as do climate models based on the well-established laws of physics. 

With that said, here are some results from the paper. First, they use results from others that found
"...overall economic productivity is nonlinear in temperature for all countries, with productivity peaking at an annual average temperature of 13°C (55°F) and declining strongly at higher temperatures. The relationship is globally generalizable, unchanged since 1960, and apparent for agricultural and non-agricultural activity in both rich and poor countries. These results provide the first evidence that economic activity in all regions is coupled to the global climate and establish a new empirical foundation for modelling economic loss in response to climate change."
In graphical form:


55°F isn't very warm. Salem, Oregon's normal annual average (1981-2010) is 53.7°F, so we're talking about a latitude just a little south of here. (I'm two miles south of the 45th parallel.)
.
Using this knowledge and the results from global climate models, Burke et al make the following projections for national per capita GDPs, which divides the world up into winners (blue), slight losers (pink), and serious losers (red):


Europe wins big. So do Canada and Russia.

The US loses between 0% and 50% of per capita GDP. That's a big range, but big consequences if you're on the wrong side of it. (Consequences I find difficult to imagine near the 50% side. I'm spoiled by the times I've lived in.)

China loses more. This is why the Chinese will want (and are wanting) to stop global warming -- not from the goodness of their hearts, but because they know they are vulnerable to it.

And -- same old same old story -- the poor get slammed.

Perhaps you can consider these the best case scenarios? Are there nonlinear economic events that are positive, not, like the Great Depression or Great Recession, negative? I can't think of one...perhaps the aftermath of WWII, at least for the US, certainly not many countries. It seems economies hum along at an exponentially increasing rate until they stutter and miss a step, a step that is almost impossible to catch up on.

The authors conclude:
"If societies continue to function as they have in the recent past, climate change is expected to reshape the global economy by substantially reducing global economic output and possibly amplifying existing global economic inequalities, relative to a world without climate change. Adaptations such as unprecedented innovation or defensive investments might reduce these effects, but social conflict or disrupted trade—either from political restrictions or correlated losses around the world—could exacerbate them."
I don't know what to make of this paper -- it seems so easy to dismiss the economics as about as reliable as, say, CBO projections of GDP made in 2005 for 2015 -- who foresaw the crash? Yet crashes exist. 

Sunday, October 18, 2015

Australia High Temperature Records 12 Times Cold Records

A September paper in GRL by Sophie C. Lewis and Andrew D. King looks at hot and cold temperaure records in Australia for the last one and a half decades. Their conclusion:
"...during 2000–2014, new hot records outnumber new cold records by 12 to one on average." 
which is a pretty large ratio. They emphasize (which should be obvious if you think about it) 
"In a stationary climate, the probability of setting new temperature records should decrease rapidly from the beginning of the sequence of observations."
Here's the graphical version of their results:


Finally, here are the temperature time series going back to 1910:


The Problem of Slicing a Cake

I'm reading this little book by Timothy Gowers, Mathematics: A Very Short Introduction. I'm mostly reading it to see how he, as a major mathematician, thinks about mathematics, which sometimes can be pedantic (for the purposes of the book), but at other times he shows how careful thinking is needed, which isn't always how sciency people think about things. Here's a good example in his book that I'd never seen before.

Suppose you want to slice a cake, and you want to know how many pieces you get with 1 cut, or 2 cuts, or 3 cuts, etc. You don't have to start slicing from the middle, and each piece of cake need not be the same size, but you have to slice all the way through the cake.

So you get slices, and pieces of cake, like this:

CircleCuttingCircumference

The number below each circle is the number of pieces of cake. Each dot is where your knife enters or leaves the edge of the cake.

For n slices, how many pieces of cake will you get?

For a small number of slices, it's easy to count up the pieces:


At this point most people would notice a pattern, and guess/assume the number of pieces of cake is 2n-1.

But, surprisingly, that's wrong.

For n=6, the number of pieces is 31, not 32 as one would likely guess.

For n=7 the number of pieces is 57, not 26 = 64. And so on: 1, 2, 4, 8, 16, 31, 57, 99, 163, 256...

That's kind of wonderful -- it shows you shouldn't try to detect a pattern or rule based on a limited number of trials.

In mathematics this is called Moser's circle problem, and the slices are called "chords." The formula for the number of pieces is


where the objects in parantheses are called combinations -- the first is the combination of n objects taking 4 at a time, and not caring about their order, etc. Here are a couple ways of solving the problem.

This was proved in 1987, showing that not all simple but interesting math problems were solved, or even proposed, 300 years ago. (Moser formulated another seemingly simple problem, the worm problem, in 1966, and it's not solved yet.)

And it says to be careful in your thinking, more careful than most of us are.

Saturday, October 17, 2015

For NASA GISS to Set a New Temperature Record...

...it needs only an average anomaly of +0.58°C for the last three months of the year -- or 0.23°C below its average year-to-date. 

So far this year, no month has dropped anywhere close to that.

Year-to-date, 2015 is +0.07°C above the second-highest year, 2014. And it's +0.13°C above 1998. which once seems so extreme.


Friday, October 16, 2015

What Computers Can't Do

"Unfortunately, while computers continually surprise us with what they can be used for, almost nothing is known about what they cannot do."

-- Timothy Gowers, Mathematics: A Short Introduction (2002)

Thursday, October 15, 2015

Stunning Picture of a Saturnian Moon

Wow -- this is the north pole of Enceladus, taken yesterday by the Cassini space probe. Taken from about 6,000 km away, with 35 meters per pixel:


Wednesday, October 14, 2015

Bad Book Reviews Versus Some Actual Science

A fawning book review for Mark Steyn's self-published manuscript by a sycophant named Lynne Cohen says
Several of the hockey stick's most obvious problems are easy to grasp. The 900-year long handle completely ignores two indisputable eras, the Medieval Warm Period, from about 950 to 1250 A.D. and the later Little Ice Age from 1300 to 1850. 
I asked her for the evidence for these "indisputable eras," and she says she's just a book reviewer with no knowledge of what she's writing of:
I want to remind you that I am not a climate scientist, only a lowly book reviewer. I have no first hand knowledge of these well-documented time periods, only a faith in the knowledge and reputations of the climate scientists who write about them. Sort of how I trust my doctor to know the pills he prescribes will heal me without my understanding how or why.  
But it seems she only has "faith" (the opposite of science) in some climate scientists whose studies (she cites zero of them) she happens to like. When I asked her again, she wrote it's all "widely accepted" so she doesn't have to provide any evidence:
Regarding the "Medieval Warm Period" and "Little Ice Age", their existence is widely accepted - I didn't invent the terms after all - within both the lay and scientific communities. I would no more provide evidence of them than I would provide evidence of photosynthesis, but I know they are all real. How? I believe the reputable scientists. 
Clearly Lynne is out of her league here.... Like so many deniers, she thinks the science is all wrong, without actually knowing any of it.... That saves time, that's for sure!

Steyn claims
There are peer-reviewed studies by over 750 scientists from over 450 research institutions in over 40 countries that have found a Medieval Warm Period of between 0.1° and 3.2° Celsius warmer than today in every corner of the globe - from Alaska to South Africa, Morocco to New Zealand, Bolivia to China, Egypt to New Guinea... Everywhere they look for it, they find it. 
while offering no evidence for this in his blog post or whether all these studies lead to a reconstruction of globally noticeable climate eras, as he and Lynne claim. Except for another opinion from the opinionated nonexpert Jonathan Jones.

OK, there was that study by the oil-funded CO2science.org...which was never published anywhere -- because CO2science wouldn't dare submit their work for peer review anywhere legitimate -- and which was debunked because the period of study of the papers cited differed by up to 500 years, and many were selectively interpreted. The study ignored "very wide" error bars, and one study that only went back to 1500 A.D. was included as evidence for the MWP. In short, that study was both wrong and dishonest.

Meanwhile, all quantative reconstruction studies I know of -- which are the opposite of scattered opinions about scattered studies by scattered nonexperts -- use available proxies to form a global perspective find no evidence for a global MWP or global LIA -- Tingley and Huybers, Marcott et al, PAGES 2k, and more.

Here's the abstract from the PAGES 2k study conducted by over six dozen paleoclimatologists from 24 countries, based on 511 climate archives from around the world and published in Nature Geosciences:


Stefan Rahmstorf, who wasn't part of this study, wrote about it for ThinkProgress, and gave the paper's main result:


Rahmstorf then gives their reconstruction, labeled by "b" below -- which is, not surprisingly, a hockey stick, because a hockey stick is expected from very simply physics:


Who are you going to believe -- the careful work by six dozen experts from around the world, who put all the data together into regional and global reconstructions, or the opinions of some nonexperts who took studies individually without trying to acquire a global perspective? 

Finally, let's note again that even IF there was a global MWP, it says absolutely nothing about the current era, when greenhouse gases dominate and the amount of energy the Sun is delivering to the Earth has been on a declining trend since about 1960.

TIM TSI Reconstruction

Interesting Things

Some of the things I found interesting lately:

Bill Gates has committed $2 billion to development of new energy technologies to combat climate change. More in this article in The Atlantic.

Abe Streep went to Wyoming and spent a week talking to the people there about coal. It is, of course, lifeblood for Wyoming's economy, and you can't help but feel for a group of Americans who -- as has happened before here, with the steel industry and car industry -- see the coming death of their industry coming and the end of their well-paying livelihoods. They clearly realize, whether all of the admit it or not, that climate change is here and the issue isn't going away (despite the best efforts of the climate thugs). At the same time, though, some of the things Streep hears from people there are just insane -- that Obama is the Antichrist, that he's a Muslim, that he's trying to kill coal for the sake of billionaire backers who are invested in solar energy.

The Hadley sea-surface temperature for September was the warmest (most anomalous) in their records, which start in 1850. It was a huge 0.06°C higher than second place, which was just last month. The last five months are among the 6 warmest months in HadSST3's records; and 3rd place is only as far back as August 2014.


Year-to-date, 2015's SSTs are +0.10°C above 1998's....

Aerosol forcings over the last 10-15 years wouldn't have explained the hiatus (which didn't exist anyway, a closer look at the data showed).

John Fleck says Lake Mead is forecast to drop even further in the new water year, by 5 feet.


Yes, Steyn and McIntyre Are These Kind of Scumbags

Wow. So Steve McIntyre gave a private email I sent to him to Mark Steyn, who publishes it without permission.

When I learned Internet ethics, that kind of thing was competely verboten.

Having to be a snake to make an argument means your cause is already lost.

But that's how Steyn chooses to make a living -- he's a thug who is reduced to earning money by ambushing scientists and whoever writes about them.

I once thought a little better of McIntyre than this. Clearly that was a mistake -- he's turned out to be the kind of snake who slithers alongside the thugs of the world, whispering wicked ideas into their ears. It's not hard to understand why McIntyre is frustrated -- his work has gone nowhere, while Mann has won a major award from his colleagues, has a prominent position with real influence in the debate, is published everywhere, and is quoted in the media basically every day.

Two of Canada's finest.

Monday, October 12, 2015

Alaska Governor Proposes Allowing Barrels of Oil to Vote

OK, it's not quite that crazy (yet). But he's heading in that direction:


In other news, Oregon Republians urge more timber clearcutting to fund forest preservation efforts, yet another study by the Heartland Institute has found that smoking is the quickest and most efficacious way to relieve the unpleasant symptoms of nicotine withdrawal, and the NRA proposes that all Americans be required to carry guns in order to reduce the US epidemic of gun violence.

Sunday, October 11, 2015

Willie Soon is Hiding

Odd -- Willie Soon is the lead author on an Earth-Science Reviews paper titled "Re-evaluating the role of solar variability on Northern Hemisphere temperature trends since the 19th century," and they list him as "corresponding author." But unlike all their other papers, they don't actually give his email address.

Instead, the usual links to the corresponding author just go around in a loop.

Strange. Why wouldn't Willie Soon want to correspond with people who are reading his paper, if he was didn't have something to hide?

The Backwards Evidence That Climate Deniers Use as Proof They're Winning

It's the latest amazing(!) rebound (don't strain your eyes trying to find it here) in Volkswagon's stock price, via Eric Worrall at Woo-What.

Because, you know, any letup of the so-called "free market" in punishing VW for their massive fraud -- fraud that killed ~ 40 Americans (hope none of them are Eric Worrall's relations!), and destroyed tens of billions of dollars of VW stockholder value -- is now apparently a VICTORY for climate deniers, who don't seem to mind breathing in particulate pollution as long as they can use it for political purposes.

In essence, Eric Worrall is rooting for more fraud like VW's, whose excess particulates cool the planet while chocking cities and killing people. Massive corporate fraud on VW's scale is now a denier's best friend.

Talk about a topsy-turvy world....

The Department of Oops - David Rose Edition

From David Rose in the Daily Mail, March 2013:
The graph shows a world stubbornly refusing to warm. Indeed, it shows the world is soon set to be cooler.
Reality:


Do you think these data show the world getting "cooler" after David Rose said it would?

No, I don't either.

David Rose gets another -1. (I hope someone out there is keeping his total score.)

Antarctic Sea Ice Max Declines by a Record Amount

Antarctic sea ice has peaked for the year, and it's significantly below last year's peak -- 1.3 million km2 below in fact.

Or, as they like to say, 14,500 Manhattan's below last year.

Or, 3 times the size of California.

It's the lowest peak since 2008. In fact, the maximum's year-over-year decline is the largest ever seen in the satellite era.

That doesn't mean the long-term Antarctic sea ice trend is reversing -- it's still very much upward.


This reversal, has, though, given a sharp reversal to annualized southern sea ice extent:


But it's still far above the trendline.

It will be fun to watch what happens from here. (But no, a resumed increase won't disprove manmade global warming.)

Wednesday, September 30, 2015

Africa's Future is in Rooftop Solar Power

Two weeks ago (9/14) the Wall Street Journal had a special supplement section on energy. One of their Africa correspondents, Drew Hinshaw, wrote from Ghana about his family's problems getting electricity from the grid there, especially now that he has an infant son -- the power is unreliable, with frequent daylong outages.

600 million Africas, he wrote, more than half the continent's population, are not connected to a power line. Those that are often have intermittent and unreliable service.

So Hinshaw put in rooftop solar where he lives, spending $3000 for two solar panels and lead-acid batteries that meet his family's basic requirements -- a refrigerator, fans, laptop, and modem.

His article. titled "So Much Sun, So Little Electricity," was accompanied with some data, which I've converted to the graphical form below. It shows, it seems to me, that the future prosperity of African societies will not come only from a vast fossil fuel infrastructure like the developed countries have, but will instead include a large amount from active individual and local efforts to utilize the the continent's most easily accessible resource.

Sunday, September 20, 2015

The Upcoming Supermoon Lunar Eclipse

This will be good, especially if you're on the west coast of the U.S.: a rare supermoon lunar eclipse next Sunday evening, followed by a bright supermoon the next night.

"Supermoon" means the moon is full and at its closest approach (perigee) to the Earth, meaning it will look larger than usual (and 14% larger than at apogee). There have only been 5 of these since 1900; the last was in 1982, and the next won't happen until 2033.


It will be especially convenient on the U.S. west coast, because the moon rises early in the evening, so kids will be able to see it without staying up late. This site has details for many of the major cities that will be able to view at least part of the eclipse -- western Europe will be able to see the ending of the eclipse Monday morning, and New York City can view the maximum at 10:47 pm Sunday evening.

The Oregonian has details for this part of the world:
For viewing in Portland and northern Oregon, the eclipse begins at 5:11 p.m., Sunday, Sept., 27, 2015. That's before it gets dark and before the moon rises, but it only gets better.

The maximum eclipse is at 7:47 p.m. next Sunday evening and continues until 10:22 p.m., for a duration of five hours and 11 minutes. For 72 of those minutes, the only light hitting the full moon will be a reddish glow from sunrises and sunsets around the globe. The full moon takes place at 7:50 p.m. PDT next Sunday.

The moonrise that evening is at 6:58 p.m., at 88 degrees (or almost due east). The sunset is at 6:59 p.m., so the sky should be getting dark as the moon goes into its full eclipse at 7:11 p.m. next Sunday. The moon will be just 8 degrees above the eastern horizon at the instant of the greatest eclipse, making the event more spectacular than during an eclipse occurs with the moon high overhead.

Saturday, September 19, 2015

Another Turd from Tony Heller (AKA "Steve Goddard")

Tony Heller -- the real name of the blogger Steve Goddard -- is so angry no one takes him seriously anymore that every other post of his (literally) is covered with spittle as he rants and raves that all climate scientistgs are criminals and frauds who have Satan over for tea.

Problem is, Heller has thoroughly earned his disreputation, with boneheaded errors like this [retraction] and this, for which even Judith Curry called his analysis "bogus."

Heller produces turds like clockwork. Here's yet another:


This is another lie, as only Steve Goddard could produce.

The Hadley Center's HadCRUT4 data series for the Southern Hemisphere is here. Here's the explanation of their file format. Notice what it says about columns 11 and 12 (click to enlarge):


If you can't read that, the last bullet item is:
Columns 11 and 12 are the lower and upper bounds of the 95% confidence interval of the combined effects of all the uncertainties described in the HadCRUT4 error model (measurement and sampling, bias and coverage uncertainties).
Thus, the 5-95% confidence limits for the HadCRUT4 SH global temperature anomaly for January 1850 are -1.055°C and -0.058°C (top line, far right) -- a huge range in accuracy, with error bars ~ 90%, and definitely not the 0.001°C Goddard claims. (Without knowing the instruments involved -- which Goddard does not -- we can't say if the precision is warranted or not. In any case, the number comes from a model, not from raw measurements.)

The effect on long-term trends: zilch.

There's a reason everyone but the Heartland Institute has dismissed Goddard as a crackpot....

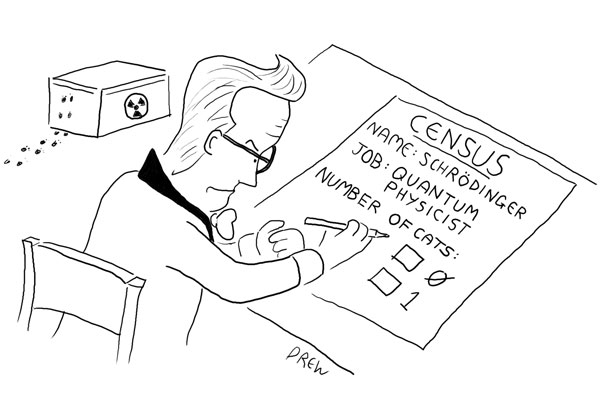
Heisenberg, Schrödinger and Ohm are in a car....

Heisenberg, Schrödinger and Ohm are in a car.

They get pulled over. Heisenberg is driving and the cop asks him "Do you know how fast you were going?"

"No, but I know exactly where I am" Heisenberg replies.

The cop says "You were doing 55 in a 35." Heisenberg throws up his hands and shouts "Great! Now I'm lost!"

The cop thinks this is suspicious and orders him to pop open the trunk. He checks it out and says "Do you know you have a dead cat back here?"

"We do now, asshole!" shouts Schrödinger.

The cop moves to arrest them. Ohm resists

(Thanks Jim.)

Cyclonic Energy at Record High

August had the highest global ACE value -- Accumulated Cyclone Energy -- of any August since records began in 1970. [data]

It's not a perfect metric of cyclonic energy -- it doesn't include a storm's size, for example, as I wrote about here and here-- but it does seem the most popular and the most published.


Of course, August also saw the highest sea-surface temperatures according to HadSST3 data (since 1850) and NOAA data (since 1880). Just a coincidence I'm sure.

Thursday, September 17, 2015

An Even Easier Way to Get a Hockey Stick: Mere Exponential CO2 Growth

When I was gone last week, someone pointed out to me an excellent (and obvious) point: Superexponential growth in CO2 isn't needed to give a hockey stick -- mere exponential growth suffices. 

That is, by the exact same reasoning I gave before, exponential CO2 growth gives a linear increase in temperature -- i.e. a hockey stick.

Since, all else being equal, temperature change is proportional to the logarithm of CO2 concentration, CO2 increasing exponentially leads to a linear increase in temperature.

So a constant atmospheric CO2 concentration from, say, 1000 AD to the year 1850, results in no temperature change.

After that, an exponential change in CO2 results in a linearly increasing temperature.

That is, a hockey stick.

So, for Steyn's book to be at all true, basic physics must be violated. Whose side would you take in that fight -- a music reviewer, or the fundamental laws of the universe?

Tuesday, September 15, 2015

Satellite-Era Sea Level Rise Starting to Accelerate

The latest data on sea level rise from AVISO is now starting to show a positive acceleration.

I'll dice the data in two ways; both show an acceleration:
  1. fitting it to a 2nd-order polynomial
  2. calculating the change in the slope of the most recent 20 years.
First, here are the sea level data from AVISO:


The second-order polynomial fit shows an acceleration of 0.005 ± 0.009 mm/yr2, where the uncertainty is calculated assuming no autocorrelation.

That's still small, but it's been increasing steadily since the 2010-11 La Nina that took a lot of water from the ocean and dumped it on land -- which Josh Willis called correctly and Bjorn Lomborg called wrong:


This fit finds that the current rate of sea-level rise is 3.83 mm/yr.

The second method, calculating the change in the linear slope of the last 20-year's worth of data (20 being picked arbitrarily) finds an acceleration of 0.021 mm/yr2. (Sorry, I haven't calculated its uncertainty.)


Even a little bit of acceleration sends the projection up fast: here is the change in the projection to the year 2100, relative to 1993:


In other words, in late 2014 the projection for the year 2100, relative to 1993, was 30 cm; now, just 2/3rds of a year later, it's up to 38 cm.

(The AVISO data record now spans 22.5 years.)

One last number, since it gives me the opportunity to use my favorite unit, the Sverdrup (Sv), which equals one million cubic meters per second: the change in the volume of the ocean from land ice melting + water thermal expansion is 0.04 Sv, or almost 21 times the flow of water over Niagara Falls.

That's more than twice the average discharge of the Mississippi River into the Gulf of Mexico (= 0.017 Sv).

The Remarkable Decline in Sea Ice

The turnaround in sea ice extent, both in Antarctica and globally, is remarkable. Yesterday's global sea ice extent was the lowest in the satellite record for Sept 14th:


with a current anomaly of -2.1 million km2.


Of course, this all may turn around at some point -- the Antarctic seems especially fickle.

Data sources:
daily Arctic sea ice extent [latest] [1978-2014]
daily Antarctic sea ice extent [latest] [1978-2014]
daily Global = Arctic + Antarctic SIE

Sunday, September 06, 2015

Arctic Sea Ice Extent, in Standard Deviations


For the entire year, 2012's record low minimum was -3.66 standard deviations from the mean.

2015's low (at least so far) was -3.10 sd's from the mean, on March 9th.

The linear fit to the data, which is pretty good, has the ice extent losing 0.09 standard deviations a year.

Thursday, September 03, 2015

Guess What I Found? Another Hockey Stick

Sami Hanhijarvi et al 2013: "Pairwise comparisons to reconstruct mean temperature in the Arctic Atlantic Region over the last 2,000 years," Clim Dyn 2013  DOI 10.1007/s00382-013-1701-4.

I'll add it to The List.


Hockey Sticks Galore

From "The Myth of Sustainability and the Quadrillion Dollar Economy: Why Must the Economy Grow?" Richard H. Robbins, Department of Anthropology, State University of New York at Plattsburgh, paper prepared for the Montreal International Conference on De-Growth in the Americas," Montreal, Quebec, May 13-19, 2012.

(Thanks Dano.)

Added 9/5: Here's a prettier version of the above (click to enlarge). Thanks again, Dano.


About TonyHellerExposed

Turns out Tonyhellerexposed is some guy named Michael LaFlamme.

Or, at least, that's what his email to me says (922.paul@gmail.com). Who knows with this guy -- he isn't known for his accuracy.

Or his decency. Like this dirty and very personal insult against Judith Curry. Inexcusable

If you don't have the courage to post opinions under your real name and you use that anonymity to cowardly insult and degrade people, your opinions aren't worth much. That goes for both the real fake Steve Goddard, and this doubly fake Steve Goddard.

Added 10:30 pm: In a second email, this guy says "Michael LaFlamme" also isn't his real name. So you can see he's nothing but deception all the way down....


Another Hockey Stick Just Showed Up

Lo and behold:

"Heterogeneous warming of Northern Hemisphere surface temperatures over the last 1200 years," Martin P. Tingley and Peter Huybers, Journal of Geophysical Research: Atmospheres, Volume 120, Issue 9, Article first published online: 14 May 2015.


That's over three dozen now. I'll keep a list here. Send suggestions and additions.

Tuesday, September 01, 2015

LBJ on Carbon Dioxide, 50 Years Ago

President Lyndon B. Johnson's
Special Message to the Congress on Conservation and Restoration of Natural Beauty
February 8, 1965

Johnson's remarks arose from a 1965 report to his Administration, “Restoring the Quality of Our Environment,” by the Environmental Pollution Panel of the President’s Science Advisory Committee, which had a chapter on CO2’s potential to cause warming.

A 1963 report by the Conservation Foundation, "Implications of Rising Carbon Dioxide Content of the Atmosphere," had warned that the doubling of CO2 projected for the next century could raise the world's temperature by 4°C. [Weart, p. 44].


My Feature in the September Issue of "Physics World"


I have the cover story in this month's Physics World magazine, about Advanced LIGO, upgrades to the U.S. gravitational wave observatory in Washington state and Louisiana that are coming online soon. These enhancements will expand by a thousand-fold the volume of space the detectors be able to search for gravitational wave sources; hopefully, it will directly and finally confirm Einstein's prediction of gravitational waves from his general theory of relativity.


You can read it here.