Wednesday, February 10, 2016

Who Will Win the Nobel Prize for Gravitational Waves?

#LIGO
When the announcement come of the direct detection of gravitational waves comes, probably tomorrow, should it win a Nobel Prize? 

Absolutely.

This is very basic physics, core-of-the-Universe type stuff. Something that will be remembered and celebrated 50, 100, 500 years from now.

Clifford Burgess, a theoretical physicist at the Perimeter Institute for Theoretical Physics in Ontario, said:
"If this is true, then you have 90 percent odds that it will win the Nobel Prize in Physics this year. It's off-the-scale huge," Burgess told Science magazine.
So who should get the Nobel Prize?

I've always thought a nice Prize about black holes would be to jointly award it to Stephen Hawking, Kip Thorne, and Roger Penrose, all of whom made fundmental contributions to gravitation on the theoretical side, especially to the properties of black holes.

Kip Thorne in 1972
But of the three, only Kip Thorne would get a Nobel Prize for gravitational waves. There is a great passage in his book Black Holes and Time Warps (well worth reading, with more flavor than Hawking's books), where he writes about walking around Pasadena, California late one night in 1976, trying to decide if he should commit to building a gravitational wave detector and all the work, scientific, political and organizational, that would entail.

He did decide to go for it, so this discovery is his as much as anyone's. He worked hard at it for a long time, and LIGO would probably not have come about without him. So he definitely deserves a piece of the prize.

Who else? The Nobel Committee has always been reluctant to award the prize to an organization as a whole, without giving part of it to an individual who led the projects -- think Al Gore and the IPCC, or Carlo Rubbia and CERN -- but I think this should come to an end soon. Collaborations are just too important now, especially in experimental physics -- the projects are too big, and the influence of any one person too small -- for that award structure to continue.

So I'd like to see half the prize got to Kip Thorne, and half to the LIGO research and engineering team, both in Hanford and Louisiana, of course.

If LIGO announces a detection tomorrow morning, this prize could be awarded as soon as this fall, depending on what collaborating evidence might exist, from astronomers or other, smaller, less resolute gravitational detectors around the world. Though I doubt many physicists would immediately doubt the announcement of a detection.

Expected Tomorrow: Annoucement of Direct Detection of Gravitational Waves - What Does It Mean?

#LIGO
The LIGO Collaboration has called a press conference for tomorrow at 7:15 am PST, and everyone expects it is to announce the first ever direct detection of gravitational waves.

Otherwise, as Peter Woit says, there is going to be a lot of disappointment.

Assuming it is that announcement, what does it mean?

I think it means that detecting gravitational waves via Advanced LIGO is relatively easy. Advanced LIGO -- the last phase of the project that started early in the '00s -- only started up in September of 2015, and even then it was being phased in over a couple of months, I was told.

So they've really only had a month or two of quality observing time. So direct detection of gravitational waves seems relatively easy -- i.e. the machine is working as it was designed to do.

It does not mean that we now know gravitational waves exist. We've known that for a few decades, since the work of Joseph Taylor Jr and Joel Weisberg based on the pulsar discovery of Richard Hulse and Joseph Taylor, Jr.

But directly detecting them is crucial, because it opens up the universe -- we can now see it with new eyes.

And new eyes have always brought vast new insights into the physical nature of the universe, whether it was Newton's experiments with prisms that resolved white light into its constituent wavelengths, or Hertz's findings with electromagnetic waves, or Curie's discoveries about radioactivity. As I wrote in my September Physics World article:
Whatever its cosmic source, the first direct detection of a gravitational wave will be big news. It will confirm a prediction from general relativity, but more importantly it will also give astronomers, astrophysicists and gravity theorists entirely new information about the objects they study. Indeed, astrophysicists hope that gravitational-wave observatories will someday operate as routinely as optical telescopes do today. If that happens, gravitational waves could fundamentally alter our picture of the universe, just as radio-wave and X-ray astronomy altered it from the placid, silent galaxies Edwin Hubble observed at visible wavelengths to the raucous universe we know today, full of quasars and pulsars, black holes and neutron stars. At some point, it may even be possible to observe cosmic events such as supernovae with light-based telescopes, neutrino detectors and gravitational-wave observatories – a new type of science dubbed “multimessenger astronomy”.
We'll see. I don't expect the announcement to be disappointing.

Friday, February 05, 2016

Quote For the Day

“Some people don’t want to see GE (genetically engineered) anything. It’s an emotional response. It’s hard to reason people out of a decision they didn’t reason themselves into.”

-- entomologist Raymond St. Leger, distinguished university professor at the University of Maryland

From a Yale e360 article about genetically modifying mosquitos.

Wednesday, February 03, 2016

Those Arbitrary Changes to UAH's Model

Am I really the only one who is stunned by what Roy Spencer wrote on his blog yesterday?
"We had been concerned that the LT temperature trends over land were too warm compared to the ocean. One hint that something might be wrong was that the trends over very high elevation portions of the Greenland ice sheet and the Himalayas were much colder than the surrounding regions (see Fig. 4 here). Another was discontinuities in the trend patterns between land and ocean, especially in the tropics.

"We determined this is most likely due to a residual mismatch between the MSU channel 2 weighting function altitude on the early satellites versus the AMSU channel 5 weighting function altitude on the later satellites. We already knew AMSU5 peaks lower than MSU2, and had chosen Earth incidence angles in each to get a match based upon theory. But apparently the theory has some error, which we find equates to about 150 meters in altitude. This was enough to cause the issues we see….land too warm at low elevations, too cold for elevated ice surfaces.

“We therefore changed the AMSU5 reference Earth incidence angle (from 35.0 to 38.3 deg.) so that the trends over Greenland and the Himalayas were in much better agreement with the surrounding areas.”
(Emphasis mine.) Changing model parameters by hand to eyeball it towards a predetermined goal? What the hell....?

Landslides and Debris Flows

Some impressive videos, via AGU:


Tuesday, February 02, 2016

Earth’s energy imbalance | Climate Lab Book

Good reading:

The Ted Cruz Pause is On Life Support

The UAH anomaly for the lower troposphere for January is +0.54°C.

While this is greater than the threshold I gave a few weeks ago, where there would be no cherry picked starting point that would give a negative slope to the present, there were sufficient adjustments on the cool side to prevent that from happening.

In the coming days there will be some adjustments to the data before the latest 13 months that Roy Spencer gives on his post, but for now there is one and only one month which, if chosen as the starting point, gives a negative linear slope to January 2016: December 1997 (18.1 years ago), for which the slope is

-0.000002°C/decade
and the R2 is a whopping 4.0e-11.

UAH made more adjustments to their version 6.0beta4. It's a good example of the complexity of their model, and of the open parameters they have to play with. Roy Spencer writes:
We determined this is most likely due to a residual mismatch between the MSU channel 2 weighting function altitude on the early satellites versus the AMSU channel 5 weighting function altitude on the later satellites. We already knew AMSU5 peaks lower than MSU2, and had chosen Earth incidence angles in each to get a match based upon theory. But apparently the theory has some error, which we find equates to about 150 meters in altitude. This was enough to cause the issues we see….land too warm at low elevations, too cold for elevated ice surfaces.

We therefore changed the AMSU5 reference Earth incidence angle (from 35.0 to 38.3 deg.) so that the trends over Greenland and the Himalayas were in much better agreement with the surrounding areas. We also find that the resulting LT trends over the U.S. and Australia are in better agreement with other sources of data.

The net result is to generally cool the land trends and warm the ocean trends. The global trends have almost no change from beta4; the change mostly affects how the average trend in 2.5 deg. latitude bands is ‘apportioned’ between land and ocean.

Sunday, January 31, 2016

The First Assessment Report's Projection for Sea Level Rise (pretty good)

A comment brought up the UNEP and United Nations University 2005 forecast that 50 million people could become environmental refugees by 2010.

I've never actually seen the real number, and the commenter didn't give one, but 50 million certainly seems likely to have been a vast overstatement.

But the actual science has been quite good. Consider this: the IPCC's First Assessment Report (1990) includes projections of sea level rise for the period 1985-2030 (Ch9 Table 9.10 pg 276):


(This looks like a digital scan of the all the original, and apparently the decimal points didn't cut it.)

How does this compare to reality? Well, it's not 2030 yet, but Aviso data on sea level show an average rate of (linear) change for the 22.8 years of their data (1993.00 to 10/25/15) is 3.34 mm/yr. So for the 45 years considered in the FAR above, that works out to a projection (if linear) of 15.0 cm.

Compare to their "best estimate" of 18.3 cm. Pretty damn good, especially when you consider that the scientific projections, which aren't linear as they include sea level rise acceleration, will likely be more than my number, so closer to the "Best Estimate" above, if not beyond it.

It's undoubtably very difficult to project what people will do in response to specific aspects of climate change -- there aren't many laws or equations in sociology. The UNEP and UNU were probably reckless in making such a projection, even over a short time period. It would be interesting to understand how they were so wrong, and der Spiegel does some of that here.

But the science here looks quite impressive.

Friday, January 29, 2016

Your Body Is Not as Disgusting as You Thought

Eurekalert:
How many microbes inhabit our body on a regular basis? For the last few decades, the most commonly accepted estimate in the scientific world puts that number at around ten times as many bacterial as human cells. In research published today in the journal Cell, a recalculation of that number by Weizmann Institute of Science researchers reveals that the average adult has just under 40 trillion bacterial cells and about 30 trillion human ones, making the ratio much closer to 1:1.
This new calculation was done for a book called Cell Biology by the Numbers,which looks really interesting and right up a physics student's alley. Unfortunately, just the paperback version is $49.95 at Amazon.

Thursday, January 28, 2016

Marco Rubio: For Cap-and-Trade Before He Was Against It

Marco Rubio just lied in tonight's Republican debate, saying "I've never supported cap-and-trade."

He did. It's so easy to find, it's amazing (and disappointing) he would ever try to deny it:


Added: Slate found another Rubio lie flip-flop lie.

Subsidies for Wind and Solar Power

Someone on a discussion forum I was reading wrote that solar power is subsidized by 96 cents per kilowatt-hour. (By comparion, the average US price for electricity is 12-13 cents/kWh.) That seemed unbelievable to me, so I thought I'd check it out. More or less, it's true.

Here are some numbers -- some recent subsidies for fuels that generate electricity, and electricity generation by source back to 1973.


So the subsidies for solar are indeed very high, and for wind they're about 25%.

Is this a problem? I don't think so. The negative externalities of wind and solar corrected 3/16: fossil fuels -- what they cost that doesn't show up in consumer's monthly bills -- are huge, especially for coal. Mercury emissions that poison streams and can have neurological impacts on infants, SO2 emissions that create acid rain, contributions to ground-level ozone, particulate matter that gets in lungs, and so on. And that's not to mention the damage to miners themselves -- coal miners suffer more fatal injuries than any profession in America. Nor does it include the devastation of mountaintops in eastern coal mining states like West Virginia.

The public pays almost of these costs, while coal companies keep the profits -- a nice form of socialism for them, or as I once put it, from each according to their smokestack, to each according to their lungs.

The report

“Hidden Costs of Energy: Unpriced Consequences of Energy Production and Use” 
National Research Council, 2010

found the cost from damages due to fossil fuel use to be $120B for 2005 (in 2007 dollars), a number that does not include climate change and that the study’s authors considered a “substantial underestimate.” For electricity generation by coal the external cost was 3.2 cents/kWh, with damages due to climate change adding another 3 cents/kWh (for CO2e priced at $30/tonne). Transportation costs were a minimum of 1.2 cents/vehicle-mile, with at least another 0.5 cents/VM for climate change. Heat produced by natural gas caused damages calculated to be 11 cents/thousand cubic feet, with $2.10/Kcf in damages to the climate. They found essentially no damage costs from renewables. (Yes, some bird deaths – but fossil fuels kill far more birds than do wind turbines.)

This is money we’re all paying in medical costs (and compromised health), and US governments now pay about half of all medical costs. 

Generating power with coal and oil creates more damage than value-added, according to a 2011 paper, with William Nordhaus (once the economist of choice for contrarians) one of the co-authors: 

"Environmental Accounting for Pollution in the United States Economy," Nicholas Z. Muller, Robert Mendelsohn, and William Nordhaus, American Economic Review, 101(5): 1649–75 (2011).

Summarizing that paper's findings: for every $1 in value that comes from coal-generated electricity, it creates $2.20 in damages. Total damages: $70 billion per year (in 2012 dollars).

Petroleum-generated electricity is even worse: $5.13 in damages for $1 in value.

In other words, according to this study, generating power with coal or oil actually sends the economy backwards.

In view of damage costs from fossil fuels of at least $120 B/yr -- which was for 2005, and I haven't tried to update it -- do subsidies for wind and solar pay off?

The numbers say it would now pay off for wind, but not for solar:


So the US could save ~ several tens of billions of dollars a year by generating all our power with wind, even when subsidized.

But good luck explaining this to people who object to renewables on the grounds that "the poor can't afford it" (like Roy Spencer is fond of doing). Well, we could subsidize the bills of the poor, but that's no excuse for you or me or someone with a nice professor's salary like Roy Spencer not to pay for clean electricity. I buy 100% green offsets from my power company, Pacific General Electric, at a cost of $0.008/kWh. It costs me about $2.20/month, or an extra 5%.

Wednesday, January 27, 2016

Dangerous Heat Waves in the Persian Gulf

Here's an nice clean graph from a new news article in Nature Climate Change by Christopher Schär, showing the extent of last summer's heat wave in the Persian Gulf.

"It was one of the worst heat waves ever recorded," the article says. Temperature peaked at about 46°C (115°F), but it's the red line that is most important: the wet bulb temperature. Wikipedia says
The wet-bulb temperature is the lowest temperature that can be reached under current ambient conditions by the evaporation of water only.
It's relevant to human health, because when the wet bulb temperature gets near body temperature (37°C), our natural cooling system -- ventilation and sweating -- is disabled.

A wet bulb temperature above 35°C is dangerous. As the article notes, it's not just the elderly and ill who are at risk in such heat waves -- everyone is, "even young and fit individuals under shaded and well-ventilated outdoor conditions."

This article is about another Nature Climate Change article last August by Pal and Eltahir that projected wet bulb temperatures in the future. Schär writes:
Although TW = 35 °C is never reached under current climatic conditions in their simulations, it is projected to be reached several times in the business-as-usual 30-year scenario period in Bandar Mahshahr and Bandar Abbas (Iran), Dhahran (Saudia Arabia), Doha (Qatar), Dubai and Abu Dhabi (United Arab Emirates), and probably in additional locations along the Gulf that have not been specifically investigated. 
And this sounds truly out-of-this-world:
Furthermore, temperatures are projected to reach unacceptable levels; for instance, in some years of the scenario period T = 60 °C will be exceeded in Kuwait City. The rise in temperature and humidity would thus be likely to constrain development along the shores of the Gulf.
60°C is 140°F.... That's hard for me to even imagine.

In the mid-1990s I lived in Tempe, Arizona for a year and a half. There were many summer days when the high temperature was above 110°F, and the hottest day I remember was 122°F. (They closed the airport that day because they didn't have specs on how well their planes fly above 120°F.) Still, I was able to ride a bike around during the middle of the day for a mile or two without much trouble -- but with much sweating afterwards -- but the humidity was low and I was younger and did a lot of hiking back then.

Winter there was perfect, temperature-wise, but the summer heat gave me cabin fever, because life always seemed like a dash from one air-conditioned place to another. I found it especially strange to go outside at 10 pm where temperatures were still 100°F or so.

The Persian Gulf, though, seems to be more humid, because the Gulf is shallow and very warm. Schär says that from 1990-2010 the Gulf region warmed at a rate of +0.47°C per decade.

Doubling Times for Ocean Heat Content

This figure is from the recent paper in Nature Climate Change by Peter Gleckler et al, "Industrial-era global ocean heat uptake doubles in recent decades." The long-term acceleration in the rate of heat gain is obvious -- another unsurprising hockey stick.

First, it's interesting to see the effects of large volcanic eruptions on ocean heat content, leading to clear, smoother and noticeable changes in ocean heat content (OHC) for the 0-700 m region. Ocean warming really is the best way to measure a planet's energy imbalance.

Is the OHC of the 0-700 m region still increasing exponentially? Or is it now linear?

While I don't have all of that paper's data handy, I thought I could easily do something similar with the NOAA data I do have. In the following plot, I graphed the doubling time for heat content for the 0-700 meter region:


So, for example, the 0-700 m heat content the last quarter of 2015 (last data point) has doubled from 13.3 years ago.

In 1995, it had doubled from 10 years earlier. In 2010 it was double that of about 11 years earlier. Etc.

So the doubling time isn't quite constant -- it's increasing slowly with time. If it was constant, the change would be exponential -- as would its rate of change -- which is must faster than a second-order polynomial which gives a constant acceleration.

Sunday, January 24, 2016

More Warming: Latest Data for Ocean Heat Content

NOAA just released data on ocean heat content for the 4th quarter of 2015 -- the best evidence, many now say, of a planetary energy imbalance. The trends continue:


Global Ocean Heat Content 1955-present 0-700 m


Global Ocean Heat Content 1955-present 0-2000 m

Compared to 12 months earlier, the 0-700 meter region of the ocean has gained 0.94 W/m2, and the 0-2000 meter region 0.71 W/m2.

Usually the larger region (0-2000 m) gains more heat than the smaller region (0-7000 m), but not this time. Perhaps that's due to El Nino -- the same happened in the latter part of 2010, which was also an El Nino year.


The (tenuous) acceleration of heating drops a hair: +1.5 ZJ/yr2, or +48 TW/yr2, or +0.09 W/m2/yr (for the top 2,000 meters). (ZJ = zettajoules = 1021 J; TW = terrawatts = 1012 W.) I'm trying to understand how to include autocorrelation for a polynomial fit, and will post that if I do.


Saturday, January 23, 2016

Largest Prime

A computer at the University of Central Missouri -- and the mathematician there, Curtis Cooper, who has 800 machines running looking for primes -- has found the largest prime number known to-date:  274,207,281 − 1. It's called a Merseene prime, because it's of the form 2M-1. It's about 22 million digits long, abou t5 million more than the previous record, and written out it comes to this ridiculous thing that begins with

three hundred septenmilliamilliaquadringensexquadraginmilliaduocenquattuortillion...  

Numberphile shows how it was done, and says anyone can download the search program and run it. (You can even win money.)


By the way, appx 2,300 years ago Euclid proved, very simply and elegantly, that there are infinitely many prime numbers. There are other proofs as well.

I wanted to understand how to calculate how many digits this new prime has.

It's pretty clear that the number of digits d(N) for any number N is (in base 10)

d(N) = INT[log10(N)] + 1


where INT(x) returns the integer portion of the number x -- everything to the left of its decimal point. For a Merseene prime this becomes

d(M) = INT[log10(2M-1)] + 1


However, we can't readily compute 2M -- it's too large, but after thinking awhile here's what I came up with:

No power of 2 has a last digit of 0 (easy to prove via induction), so the last digit of 2M does not end in zero. 2M is even, so its last digit is either 2, 4, 6, or 8. So 2M -1 has a last digit of 1, 3, 5, or 7, but not 9 because 2M never has a last digit of 0. (It also can't end in 3 or 5, because it'd be evenly divisible by the same integer; unless it was 3, which is the first Mersenne prime.) So the last digit of 2M-1 can only be 1 or 7.

Hence, the integer part of log10 of 2M-1 will be the same as the integer part of log10 of 2M. So

d(M) = INT[log10(2M)] + 1 = INT[Mlog10(2)] + 1

which is easily calculated -- in this case it comes to 22,338,618.

Wolfram has a list of Mersene primes, with strings of their first several digits and last several digits. Sure enough, they all end in 1 or 7.

Interesting:  If 2M-1 is prime, then M is prime. Slate says the 11 largest known primes are all Merseene primes (and the article has other interesting facts about primes). Notably, it has been conjectured ther are an infinite number of Merseene primes, but not proven.

Prime numbers are interesting and weird. Statements about them are often easy to make, but very difficult to prove. They leak into other important areas of mathematics, like Riemann's Hypothesis. It almost seems like there is some hidden part of the geography of all mathematics, relatively simple and straightforward and, like a lost city, just waiting to discovered behind a towering mountain pass. Some 22-year old genius in the year 2273 will finally bridge the gap by going around the pass, not over it, opening up a whole new world.

Thursday, January 21, 2016

Too Good Not to Post

There were a couple of graphs from yesterday that are too good to pass up. First, from Gavin Schmidt:


From Zeke Hausfather -- the raw data also set an annual record:

Embedded image permalink

Friday, January 15, 2016

Thanks

I'm gonna take some time off to do other things. 
Maybe a day, maybe a week, maybe a year or perhaps even a decade.
Thanks for reading. See you later.
 

Thursday, January 14, 2016

Gilmanton NH in January

There's nothing I've ever found that is like New Hampshire in January. It is nothing but white everywhere, frozen solid, very crisp and, like the picture below, often very clear. I've never known anything else like it. Temps down to -15 F and -20 F, daytime highs in the upper single digits.

It is cold. It is frozen and white, deeply. It is truly like a different world, and those are really hard to find.

From my friend Ann:


Want a Real Conversation? You Got One.

Ted Cruz: Your "18 Years" of No Satellite Warming is in Mortal Danger

The claim that there has been no global warming for 18 years is about to end.

It should end in early February, when UAH releases their anomaly number for the lower troposphere. (Here I'll focus on UAH's LT data.)

Of course, this claim has always relied on anti-scientific cherry-picking: choosing your starting point to get the result you want, whether it's scientifically meaningful or not. As I wrote here, the claim of "18+ years of no warming" relies completely on the warming spike of the 1997-98 El Nino. If that event (= natural variability) had never happened, this "pause" wouldn't now being occurring.

But now, even that strong influence is being overtaken by higher temperatures.

Here are the numbers:


Red shows the "reverse warming" of the lower troposphere according to UAH -- the warming from any point on the x-axis to present.

As you can see, the "pause" in LT warming relies on a very careful cherry pick -- starting your calculation near the dip early in 1998.

Early this February, UAH will release their anomaly number for January 2015. As long as it is +0.51 C or larger, the warming (blue line) will no longer start in negative territory for any date in the past.

The "pause" will disappear.

Will January's LT anomaly reach 0.51 C? It'd better, or UAH's model is going to look awfully suspicious. Because during the 1997-98 El Nino, UAH LT anomalies increased drastically in the first few months of 1998:


So there's good reason to think UAH LT anomalies -- which so far have been larger than in 1997-98 (= probably AGW) by about 0.2 C, should easily be above 0.51 C this month.

Will Chris Monckton, Werner Brozek and the usual suspects find a way to keep the pause going? Probably, using error bars or statistical tricks. It will be fun to watch.

But it will be grasping at straws.

Note: I'm putting the "Numerology" logo atop this post because this kind of analysis has always been numerology, not real science. Live by numerology, die by numerology.

Have Gravitational Waves Been Detected?

#LIGO
Since Monday, when Lawrence Krauss tweeted and confirmed a rumor, there is a lot of traffic repeating and questioning the rumor that LIGO has detected gravitational waves.

It's worth emphasizing that there is little-to-no doubt that gravitational waves exist. That evidence is very strong, though indirect.

As I wrote about for Physics World a few months ago, after visiting LIGO's Hanford facility in Washington state, Einstein's equations of general relativity predict that gravitational waves should be emitted by any object (mass, or pure energy) in motion. But these waves aren't sine waves, like the canonical image of electromagnetic waves we all have, self-propagating through space.

That's because there is only one type of mass -- positive -- whereas there there are two types of electric charge -- positive and negative. So unlike for electric charge, there is no "dipole moment" for mass.

Instead, a "quadrupole monent" is the simpliest gravitational wave.

I'm not going to write here exactly what this means technically. But it does mean that gravitational waves are unlike other waves that we're used to. As they move through space, they squeeze it in one dimension, but expand it in the other.

The analogy I used was that of puckering up, and puckering down, for a kiss -- your top and bottom lips go up and down, while the side of your mouth comes in and out.

The indirect evidence for gravitationl waves was made by Joseph Taylor Jr and Joel Weisberg, utilizing a new type of pulsar discovered by Taylor Jr. and Russell Hulse in 1974. They won the Nobel Prize for the discovery of that pulsar. (See the "Pulsar Detectives" box on the second page of my article).

As you'd expect, a pair of stars orbiting around one another would get closer and closer, and the energy they lose is released as gravitational waves. This can be calculated from Einstein's equations -- it's not as easy calculation, by any means, but it is straightforward -- and that prediction is in spectacular agreement with what was observed by Hulse and Taylor's stellar pair. (See graph to the right.)

It's worth nothing that that, while Hulse and Taylor discovered this special pulsar as part of a pair, it was Taylor and Weisberg who showed that its decaying orbit was in agreement with Einstein's prediction. People often get this wrong. Perhaps Weisberg should have gotten the Nobel Prize too.

But while we know gravitational waves exist, detecting them directly, as LIGO is trying to do, would still be a big deal. Gravitational scientists hope that detection of gravitational waves might soon become routine, just as detecting stars via visible light and radio waves and x-rays is routine today.

If so, this would provide astronomers with a new "sense," a new way of not unlike how hearing is a different sense to seeing.

Those new senses brought about a truly new view of the universe -- from the placid, steady state found by Hubble et al, to the wild and racuous view of stars and galaxies we know today.

Direct detection of gravitational waves could inspire the the same type of shift.

If this detection is true -- and Lawrence Krauss backed off a bit on Tuesday -- it suggests that detecting gravitional waves directly could be easy with Advanced LIGO, their latest and last-planned upgrade, since they just started running their machine in full detection mode this past autumn.

This massive tomb is its own black hole.
A direct detection would defintely be a most important result here -- easily worthy of a Nobel Prize for trhe project leaders and also especially to Kip Thorne (now retired from Caltech, and an advisor on the movie Interstellar), who has been pushing for the LIGO machine since Day One and was instrumental in not just getting the project going way back in the 1980s, but who has fundamental to its design since then.

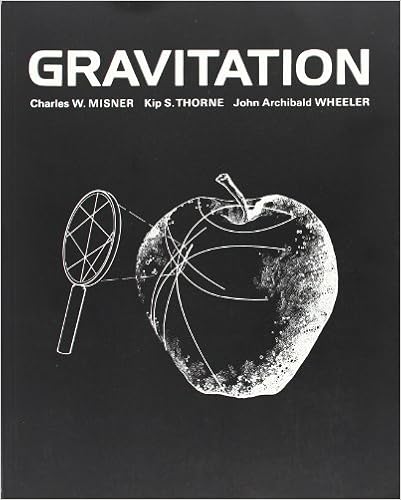
As a theorist, Thorne has had a powerful influence on the progress of general relativity since the 1970s. All real students of science, at least my generation, drag around his 5.6 lb textbook published with Charles Misner and John Wheeler in 1973. (I used to say its cover was black because no light would possibly escape its huge mass.)

Thorne should definitely win the Nobel Prize, especially if LIGO has really detected gravitational waves. I'm not sure who else would get it, on the experimental side. On the theoretical side, I think Stephen Hawking and Roger Penrose deserve it too, but it's unlikely the Nobel committee would award it to three theorists and at least one LIGO experimentalist.

Tuesday, January 12, 2016

Maybe the Best Speech I Have Ever Heard

I usually can't stand political speeches, full of false words and sanctimony, but President Obama's State of the Union speech tonight was one of the best, most straight ahead, most hopeful speeches I have ever heard. This is his last SOTU, and he knew he was free to say whatever he wanted, and he did. I thought this was especially good:

From the Huffington Post:
President Barack Obama dissed those who deny the science around climate change during his last State of the Union address.
"Look, if anybody still wants to dispute the science around climate change, have at it," Obama said. "You’ll be pretty lonely, because you’ll be debating our military, most of America’s business leaders, the majority of the American people, almost the entire scientific community, and 200 nations around the world who agree it’s a problem and intend to solve it."
Obama touched on the topic while speaking on innovation, saying we need to tap into the "spirit of discovery" in order to solve some of "our biggest challenges."
"Sixty years ago, when the Russians beat us into space, we didn’t deny Sputnik was up there," Obama said. "We didn’t argue about the science, or shrink our research and development budget. We built a space program almost overnight, and twelve years later, we were walking on the moon."

Sea Surface Temperatures Blow Away Existing Record

Today the Hadley Centre posted its anomaly for December -- it's here -- and 2015's annual average completely destroyed the previous record -- 2014's -- by 0.11°C.

Coming in third is the El Nino year of 1998, at 0.17°C below 2015's value.

This is a huge jump, almost a decade's worth of warming in just one year. (The 30-year trend for HadSST3 is +0.135°C/decade.)


Thursday, January 07, 2016

This El Nino's Lower Troposphere Temperature, Compared to the Past

Here is a nice, relevant plot from Sou at Hotwhopper: it shows UAH's calculation of the lower troposphere temperature anomaly, for this El Nino, 2009-2010's, and 1997-98's.

This year is significantly ahead:


And here's an update to an (admittedly confusing) graph I've given before: a comparison of surface temperatures during this El Nino, compared to 1997-98.


Even though the strength (dashed lines, left-hand axis) of the respective El Ninos is comparable, with this year just a little ahead of 1997-98's, surface temperatures (solid lines, right-hand axis) are consistently higher by 0.2-0.4°C. There's your global warming.

2015's key climate science research advances - Yale Climate Connections

http://www.yaleclimateconnections.org/2016/01/2015s-key-climate-science-research-advances/
  

I'm Sorry, But I Really Like This

(Except for the part about being in captivity, of course.)

Man Tries To Feed Medicine To Pandas. Pandas Have Other Ideas


Via Wimp.com

Wednesday, January 06, 2016

Lower Troposphere "Pause" is Purely an Artifact of 1997-98 El Nino

With each month's measurements of the temperature anomaly of the lower troposphere comes the by-now standard claim that "there's been no warming for 18 years and X months." X varies a little -- but it doesn't seem to get bigger with time.

It's straightforward to show that this "pause" in the LT is purely a product of the 1997-98 El Nino -- that is, of natural variability. It would not exist without it, if everything else stays the same.

In the following graph I plot what I call the "reverse trend" -- the trend from any year on the x-axis to today. So, for example, the graph shows that the trend from 1983 to 2015 is 0.12°C/decade, and from 2003 to today is 0.04°C/decade. (There are error bars, but the point made here doesn't depend on them so I'll leave them off.)

The red line is the actual measured temperature anomalies. (I used annual averages to keep this simple.) The blue line assumes simply there was no big El Nino spike and that 1998's anomaly was the average of 1997's and 1999's.


As you can see, the "pause" for the actual data -- the red line's dip to slight negativity in 1998 -- depends closely on choosing 1998 as one's starting point. That's precisely the definition of a "cherry pick" -- choosing the starting point to give the result one wants, regardless of its scientific legitimacy or whether it is long enough to represent climate, and not natural variability.

The blue line, with no 1997-98 El Nino, shows no pause at all at that point. In fact, it's never negative for any starting point before 2015.

As expected, the trend over climatically representative intervals, such as the 30 year period 1985-2015, is essentially identical to that which includes the natural variability of that big '97-98 El Nino. El Ninos and La Ninas balance out over the long-term. (They're not the only natural factors that can have an influence, of course -- volcanoes and changes in solar irradiance do too -- but no need to include them here to make the point.)

And shorter trends, of about 10 years or less, aren't statistically significant, and usually not even close to being statistically significant.

The lower troposphere "pause" over 18 yrs X months is purely an artifact of a big El Nino -- that is, of natural variability.

Note added 9:00 pm: A commenter asked a good question: what about the other El Ninos that have occurred since? The average of the monthly MEI (Multivariate Enso Index), an ENSO proxy, from Jan 1999 to present is 0.04, very close to neutral. (For example, 1997's MEI was 1.58. 2015's is 1.59.

In other words, La Ninas and El Ninos have tended to cancel out since 1999. So it's not a bad assumption to take the data as it is, excepting only the 1997-98 El Nino. But it's not a perfect assumption, as one would still need to account for ENSOs before 1999 -- the average MEI from January 1979 to December 1996 is 0.48.

Thursday, December 31, 2015

2015 Arctic Sea Ice Extent, Compared

The Japanese group JAXA gives their daily Arctic sea ice extent (SIE) about 9:30 pm my time every night, so I can summarize their annual data for 2015:


This is How Denialism Ends, one Delingpole at a Time

The cracks appear now one-by-one, and there's no mistaking them.

They come faster than they used to -- one denier after another giving it up, acknowledging the warming that's taking place, and the role of humans in creating it.

Today's crack -- loud and sharp -- come from Breitbart, an extremely conservative site that I can't imagine any thinking person takes seriously as a source of news. (They banned me from commenting there long ago.) Today they have a story that reveals everything:


This is how denialism ends, friends. Exactly how.

They just admitted that global warming is happening. They just don't like what they assume is the solution.

Of course, no one likes to admit defeat. So they go out, naturally, in a fit of rage, spitting and sputtering, disparaging everyone, insulting all, hating even themselves -- because that's about all denialsim is anymore, rage, anger -- even though now they apparently accept the science. James Delingpole writes:
I’m proud to say that I come in at number 6 (though obviously I would have preferred higher) with my statement that alarmist climate scientists are “a bunch of talentless low lives who cannot be trusted.”

In retrospect I wish to apologise for that sentence.

What I really should have said is that these are a bunch of lying, cheating, scum-sucking, bottom-feeding, third-rate tosspots who don’t even deserve the name “scientists” because what they practise isn’t really science but data-fiddling, cherry-picking, grant-troughing, activism-driven propaganda. Posterity will grant them about as much respect as we now accord the 17th century quacks who bled their patients using leeches, or the early 20th century German scientists who helped Hitler compose his diatribe against the discredited Jewish science of Einstein, or the scientists who ganged up on Alfred Wegener for his novel – but correct – theories on continental drift. Really, if none of them ever published another paper in their lives and all their grant funding dried up at midnight tonight, the cause of climate science would not suffer one jot – and the world would become a much better (and richer) place.
A simple "I was wrong" is too humble for Delingpole, far too polite, far too decent.

Too introspective for a clown.

So let Delingpole whine. Let him bitch to his small heart's content. He's already ostracized himself to the stark edge. And we know about this clown. It's already been shown that Delingpole is a fool. He doesn't need to read scientific papers. Not that he could understand them anyway.

Not he's just fallen back to the question of solutions.

That's a huge setback for a denier like Delingpole to admit. Huge.

Hey, not all of us like the thought of global governance either.

Frankly, I'd prefer most of the decisions about me and my life be made right here in my own community, this block and a couple of nearby others in the neighborhood. Small is beautiful, and people want -- need -- to determine their lives on as local a scale as possible. We are dying for a lack of it, I think.

But small doens't meet the need of those how want to make an empire, who want power, who want to get rich from it, and it never will. This has been a problem for centuries, and will be so increasingly into the future, I think, with globalization. It will always be a fight. People work better, work more morally as individuals in small groups, where they know names and faces, not as nameless technocrats making decisions for hundreds of millions of people.

So then, Delingpole, let's see your solutions to global warming that accord with your ideology. If, as seems apparent, you now believe in global warming but don't like the solutions proferred on a global scale -- on the scale of Paris, even though the scale of this problem is certainly global -- then instead of denying the science, start proposing solutions to this problem that accord with your ideology and political desires.

Market based? Locally based? Describe them.

Because if you don't start soon, James -- very soon, like now -- you will get stuck with the solutions of others, those you disagree with, your ideological enemies, solutions forced on you by the majority that you twill have to live with.

That's the risk you've been taking now, Delingpole -- and you Watts, and Spencer, and Steyn -- and after Paris it's more clear than ever -- keep up your silliness, your blind, dumb denial, and get stuck with solutions you don't like.

It's about time Delingpole came to this position. Sure, it would take any extremist awhile to come here -- they're extremists, after all.

I still think Anthony Watts will apologize for his denialism before he dies. I do.

Mark Steyn will only if it gets him viewers or listeners or if it sells books. I don't think he has an honest, genuine bone in his body. And you can bet that, when/if he does admit to the science, he will find a way to blame the problem all on those godless liberals, because they didn't do something that would have led to a solution long ago. Watch for it.

Meanwhile, enjoy this quantum leap forward. But they do come. No one has been able to resist the power of science. Ever.

Monday, December 28, 2015

Antarctic Sea Ice Extent is Tanking....

So says the daily data from the NSIDC. Antarctic SIE is currently 16% below last year's value at this time -- a decline of 1.54 million square-kilometers. Likely a result of this big El Nino, I suspect.


Personally I find it more enlightening to look at the 365-day moving average, which is decreasing but still above its trendline

:

Friday, December 18, 2015

Even If Watts et al Claim is True, No Change in Global Trend

Even if the Watts et al unpublished claim is true -- that the trend for the continental USA is only 2/3rds of the current published value -- the chance on the global trend is miniscule.

I did a quick calculation. If the current USA48 trend is SUSA48, and the Watts et al claim is true that it is really (2/3)SUSA48, then the change in the global trend will be (weighting by areas)


where "ROW" = rest of world. So


where f is the ratio of the area of USA48 to the area of the globe (=1.6%). So


So the decrease in the global trend works out to be only -(f/3)*SoldUSA48 = -SoldUSA48/188.

NOAA's 30-yr trend ("old") for USA48 is +0.15 C/decade, so the change in global trend is in the fourth decimal place -- only -0.0008 C/decade -- and far below any error bars. Infinitesimal.

Greenland's Ice Mass Loss Rate Has Doubled in a Decade

From a Peter Sinclair video for Yale Climate Connections:


Thursday, December 17, 2015

Warmest November Yet, 2nd-Warmest Month Ever

Both NASA GISS and NOAA have posted their November temperature anomalies in the last few days, and both are searing.

GISS found November to be +1.05°C above the 1951-1980 baseline period, and NOAA found it to be +0.97°C above their 1981-2010 baseline.

I should bring those to a common baseline. Maybe later.

Both are guaranteed to have 2015 as the warmest year in their records, unless a huge meteroid slams into Earth, like, tomorrow. (I  hope it's not before my flight home.) The GISS anomaly for December needs only to be greater than -0.38°C for 2015 to be a record, and NOAA needs it greater than -0.76°C. As my niece says, easy peasy.


Rapid warming reported in planet's lakes - Yale Climate Connections

http://www.yaleclimateconnections.org/2015/12/rapid-warming-reported-in-planets-lakes/
  

Wednesday, December 16, 2015

Why the Claim of "No Warming in 18 Years" is a Blatant Cherry Pick

So by now everyone is used to the Mocktons of the World announcing, after each new month of satellite data on lower tropospheric temperatures, that there is an "18-year pause," plus-or-minus a few months. Ted Cruz even said so in his recent faux Senatorial hearing.

Wonder why they only cite the 18 year and a few months trend? Here's why:


Here I plot the amount of warming in the lower troposphere as a function of how far back you start looking -- what I call the "reverse total change."

So, for example, the temperature change for the lower troposphere over the last 30 years is, according to UAH version 6beta4 (their latest version), +0.31°C, with error bars of 0.06°C for the 5-95% confidence level (no autocorrelation).

Now you can can wee why they cite "18 years" or so -- it's a massive cherry pick. Picking a number longer than this and the amount of warming quickly rises. Pick a number shorter than this and it does too, though the error bars get big enough that a solid conclusion is not possible. (For example, you could try to say the LT pause is "14 years," but I can't imagine anyone claiming that 14 years is representative of just AGW and not natural variability. Though some probably try.)

Lesson: Picking the 1997-98 El Nino to start your trend isn't copacetic. One needs to account for natural variations (here, especially ENSOs) to pick out the anthropogenic signal.

I'm sure Ted Cruz couldn't care less -- he'd say whatever he needed to say to futher his agenda -- but the rest of us should.

Science versus Art

I saw this quote in a session here at AGU today:
"Science is what we understand well enough to explain to a computer. Art is everything else."

-- Donald Knuth
Knuth is a famously creative and eccentric computer scientist who wrote the classic 4-volume book The Art of Computer Programming, and developed the TeX word processing program that makes manuscripts and their equations look elegant and pretty.

Don Wuebbles: Dangerous Climate Change is Already Here

http://www.yaleclimateconnections.org/2015/12/some-severe-weather-events-more-common-a-likely-trend/
  

Tuesday, December 15, 2015

The Onymous Guy: Diamonds - and CO2 - are forever II (wonkish and long)

The Onymous Guy - a learned friend here in Oregon -- has some great posts lately that I should have been mentioning. Including his latest:

Diamonds - and CO2 - are forever II (wonkish and long)
http://onymousguy.blogspot.com/2015/12/diamonds-and-co2-are-forever-ii-wonkish.html

More glum news on Arctic warming

http://www.yaleclimateconnections.org/2015/12/more-glum-news-on-arctic-warming/

Watts and Appell Intersect

I don't have a lot of time to blog this week, but this is worth reading:

http://wattsupwiththat.com/2015/12/15/the-most-eye-opening-thing-ive-seen-while-at-agu15-so-far-muslimcarolers/
  

Jim Hansen pans COP21 'baloney' - Yale Climate Connections

http://www.yaleclimateconnections.org/2015/12/jim-hansen-pans-cop21-baloney/
#AGU15     

After the Paris pact, thoughts on the Ted Cruz climate change hearing - The Washington Post

Friday, December 11, 2015

El Nino Seems to Have Peaked

This year's El Nino peaked in the last few weeks, slightly higher than the 1997-98 monster (which was once considered a monster).


The latest NOAA weekly status shows similar peaks for the other Nino indices, and says " Niño
3.4 will remain strong into early 2016."

El Ninos usually bring rain to southern California and dry conditions to the Pacific Northwest, but this year it looks upside down: California is still weeks away from receiving rain, while Oregon and Washington have been getting pounded this week with several inches of rain -- over 6 inches where I live -- and strong, blustery winds. It's led to lots of flooding and landslides -- one landslide closed down the northbound lanes of I-5 in southern Washington -- and even a tornado that damaged a few dozen homes.

I don't mind the nasty weather -- it's really the only interesting weather we get around these parts -- but then I work from home and haven't been flooded out or in a tornado's path.

The Farce of the Cruz Hearing

Ted Cruz's "hearing" on climate science, "Data or Dogma," was, of course, nothing but a farce.

Each of the "witnesses" who "testified" there knew that going in, and each of them is now partly responsible for perpetuating that farce.

Judith Curry wrote:
Senator Cruz seems very much into the Data, and generally knowledgable about the scientific process.  One of his staffers is an avid reader of CE, WUWT and apparently Steve Goddard’s blog.  
Again, a farce. How can people with scientific training pretend they didn't know what Cruz was up to, let alone aid him in that hustle?

The biggest farce was, of course, Mark Steyn, the male-gendered Ann Coulter, who is an expert on nothing and had absolutely no business "testifying" before that committee. Michael Crichton was a saint compared to Steyn, though equally as wrong.

Steyn presented nothing but the idiocy of Rush Limbaugh, which clearly he aspires to be -- a man who is as responsible for the ongoing decline of America as anyone. Steyn seems happy to be a Limbaugh copycat, because it gets him attention with the American underbelly who buys his Islamophobic books.

Steyn's hatred of Muslims quickly dropped him into the darkest chasm available, when he inhumanely dismissed the fate of southern Pacific islands who will be swallowed by the rising seas of global warming. It wasn't dismissal based on his expert understanding of sea level rise, but -- not surprisingly -- just another vehicle for his marketed hatred:
“The entire population of the Maldives are Sunni Muslim, so they will fit in perfectly fine if they all move to this Brussels suburb that produced the shooters in Paris.”
That isn't your ordinary every-day prickiness -- this is a whole new level of how to be a prick.

But hey, it sells books and attracts (a few) listerers, even if they are nutters. What could be more important?

General Steyn --  hardened soldier and noted military expert -- also gave his learned opinion on the national security repercussions of climate change, just two months after 48 national security and foreign policy leaders, diplomats, and former members of Congress from both parties ran a full-page ad in the Wall Street Journal calling for climate change action. Think Progress quoted Steyn from Tuesday:
“I can’t tell you how absurd it is to be talking about the security threat [of climate change],” Steyn said. He then went on to talk about how the growing population of West Africa was a greater threat to international stability. “All those people are just going to get on a boat and walk into Italy, Greece, Spain, Portugal, and the idea that climate change is [impacting] that is absolutely trivial to the remorselessness of those [population] numbers.”
Steyn shamelessly has the audacity to write
In this case, the Democrats asked no questions of anyone other than their guy - Rear Admiral Titley.
as if the other three "witnesses" weren't explicitedly chosen for their extreme right-wing views.

Did Steyn perhaps think he was invited on merit??

--

Edward Markey of Massachusetts said on Tuesday
“The only thing that requires a serious scientific investigation is why we are holding today’s hearing in the first place.”
which is about as good a summation as you'll find. Cruz's hearing only shows how far he'll go to distort and dismiss science, and how eagerly some scientists will enable his neo-fascism. Hey, if Cruz is elected, maybe Judith Curry can get an appointment from him high up in NSF or the Department of Energy, and then spite all those who have done her so terribly wrong. Perhaps she has a list of names already started.

Stoat gets the last word:
Data or Dogma? (full title “Data or Dogma? Promoting Open Inquiry in the Debate over the Magnitude of Human Impact on Earth’s Climate”) is the hearings promoted by U.S. Sen. Ted Cruz (R-Texas), chairman of the Subcommittee on Space, Science, and Competitiveness.

Happily, this is one of those questions we can answer easily: when you’ve got so few scientists you’re willing to listen to that you’re obliged to invite Mark Steyn to speak, then you’re the one pushing Dogma.

There, that was easy, anything else?

Saturday, December 05, 2015

50th Anniversary of the Kecksburg UFO Incident

This Wednesday, December 9th, is the 50th anniversary of one of the most famous UFO incidents in history, call the Kecksburg UFO incident, and actually I remember this when it happened.

I grew up about 7 miles from Kecksburg, in a place called Acme. (Funny name, but Acme means "the best or highest point;" we were on top of a mountain ridge.) Kecksburg is a small village -- not even a town; I remember it for its Coke bottling plant, where a local high school star/ex-major league ball player from the area worked, and the Kecksburg Fire Department's summer fair. It's in southwestern Pennsylvania, and Acme, where my family and my grandparents and cousins lived, isn't even a village, just houses stretched out along rural roads.

But it was a great place to grow up, with a lot of freedom that seems sadly unavailable to many of the kids of today.

Anyway, there was a fireball in the sky, and something struck in a hillside behind Kecksburg. I was five when this happened, almost three months from turning six, and I have a very distinct memory of going out onto our front porch with my mom, and someone, my dad I think, and maybe others he was with, excitedly indicating or pointing to something that had happened over the local hill in front of us, in the direction of Kecksburg.

I remember it was cold on the porch, like I should have had a jacket on but didn't because we rushed out there, and I distinctly remember it was the dusk of an early winter day, for that time of year in Pennsylvania, still without any snow on the ground. That links up with the date of the Kecksburg Incident, December 9th, and the time of day it happened -- I remember it felt like the time of day when you should be coming inside to wind down and get ready for dinner, with rosy cheeks from the cold.

From a 1998 retrospective article in the Pittsburgh Post-Gazette:
A 1991 article in The Pittsburgh Press described generally what happened, based on various witnesses accounts that are included in greater detail in Gordon's video.

Dec. 9, 1965, was a dreary day in Westmoreland County - that is, until what was described as a roundish fireball appeared. It reportedly seared the gray sky at low altitude with a jet trail, then made S-turns and what appeared to be a controlled landing through the treetops into Kecksburg's woods.
I didn't see any fireballs, but others in our driveway must have. My dad was a member of the Kecksburg Fire Department, but when he went to fires it was out of their rural station in Acme. I don't remember if he went to Kecksburg that evening. It would have been like him to do that, but I don't remember him, or anyone, talking about this afterward. But somehow I did acquire a vague feeling that something strange had landed in that direction, that officials rushed in, chased everyone out and removed some object on a truck.

The picture to the right is a replica of what some local people say they saw before officials -- local law enforcement? Military? Men in black? -- arrived and took over. Including the strange writing along its base.

So I was surprised to learn just a few years ago that the Kecksburg Incident is very well known in UFO lure and considered one of the most significant events outside of the famous Roswell, New Mexico incident.

There is a long string of investigations into this incident by journalists and UFO enthusiasts and the like, complete with all the required lure about coverups, lost files, the apparent silencing of a radio reporter who was killed a few years later under mysterious circumstances, FOIA lawsuits and the like. There are many videos on YouTube about it, including some full length documentaries by the likes of UFO TV. I watched a documentary a few years ago from, I think, the SciFi channel, and it was interesting, and, to me, especially for the southwestern Pennsylvania accent (which includes the regional word "younz," meaning the same as "you'all." which I didn't break myself of until graduate school), and because they interviewed an older man who was the spitting image and sound of my grandfather (but wasn't; just a man of exactly the same era and upbringing).

I'm not really the kind of person to dig into things like this too deeply. My loss, perhaps, but I figure the likeliest explanation was that some early satellite came down and panicked the stiff-collared government types in the midst of the Cold War. (The glyphs on the picture above do look a bit like letters from the Cyrillic alphabet that might be on the side of a Soviet satellite.) But it's been interesting connecting these almost dreamlike memories I have with something interesting that actually happened then.

Frankly, I hope it was some strange craft from elsewhere in the universe, and it's hidden away deep in some government bunker beneath the steep hills of Pennsylvania or West Virginia, still defying all the tests of science, still too risky to expose but ever closer to a Torchwood-like investigator's impatient leak. Wouldn't that be great?

Cartoonist Off By a Factor of 1400

This cartoon is from Dana Summers of the Tribune Content Agency.

Except burning a gallon of jet fuel emits 21.1 pounds of carbon dioxide, according to the EIA. So 20,000 pounds of jet fuel emits 211 (short) tons of CO2. Summers' number is too high by a factor of 1400.

It seems he only cited Obama's jet fuel consumption, and no one else's. The juxtaposition of the two numbers seems to indicate they're related, but they're not.

Wired says the Paris conference will emit 300,000 tons of CO2, which isn't that much really -- it's what just 18,000 Americans emit in a year -- or as Wired puts it,
"...22 seconds of global CO2 emissions. Add in two weeks of hotels, taxis, espressos, pastries, and wine toasts, and you can probably tack on another half second or so."
There is probably some double counting there, since the people are the conference aren't taking taxis at home, or eating pastries at home, or drinking wine at home. But the flying definitely counts extra.

Would it have been better off if everyone stayed home? No -- conferences are valuable, and Web coverage of them seems ever more available. The IPCC conference is more valuable than most, and worth some emissions. The solution to climate change isn't -- and will never be -- living in tents. It's generating the energy we need in ways that do not emit carbon.

Wednesday, December 02, 2015

Ted Cruz Stacks the Deck

Here are Cruz's four witnesses for an upcoming hearing of the Congressional Subcommittee on Space, Science, and Competitiveness, December 8th. Notice a pattern:


Not one scientist from the vast majority of scientists who know the evidence and proof for AGW.

Now imagine if this neo-fascist became president.

The hearing will be streamed live at http://www.commerce.senate.gov.